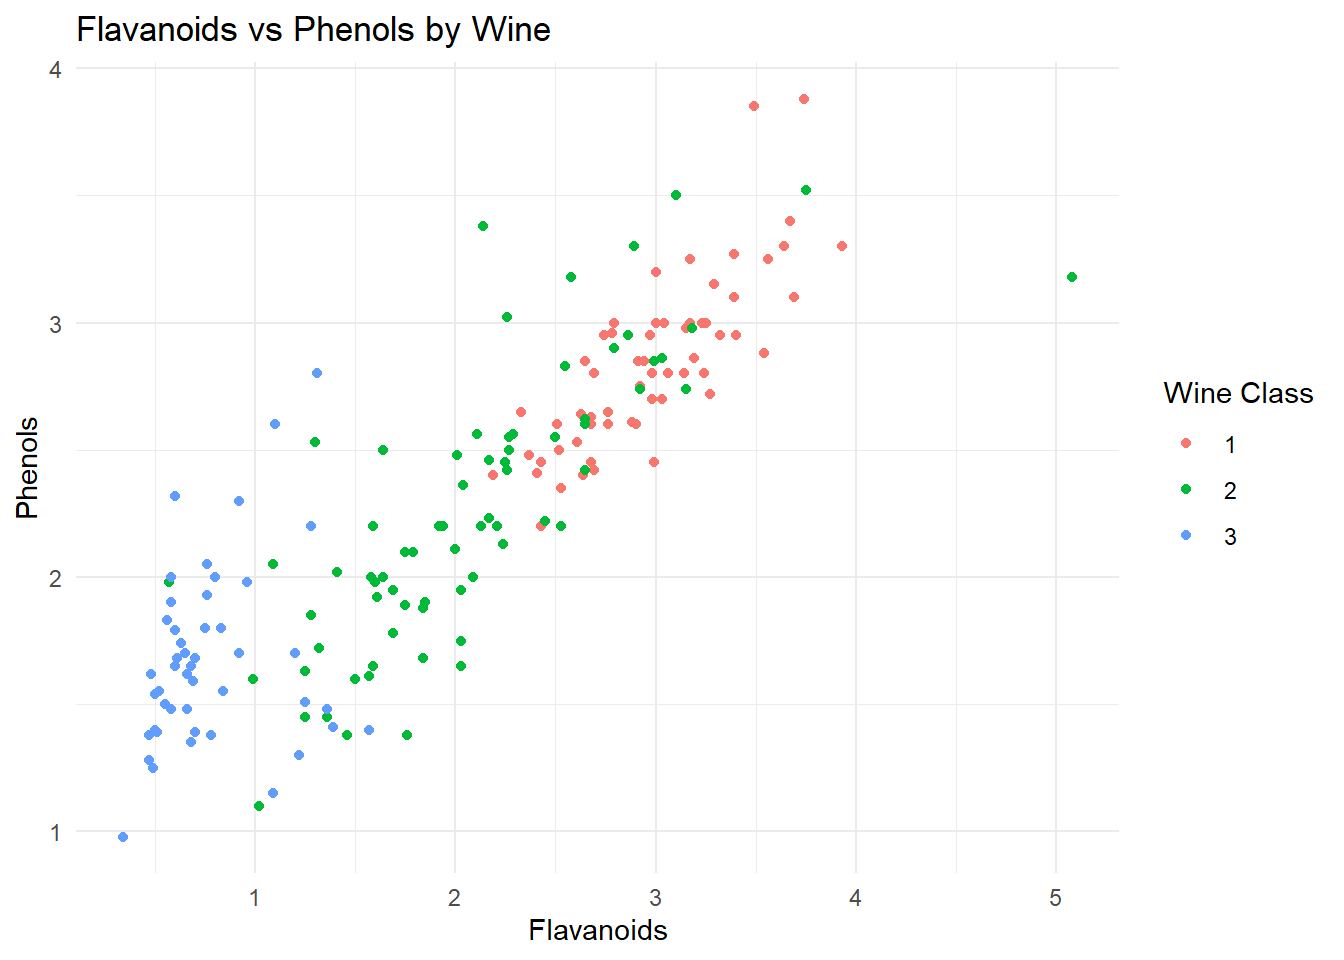
ggplot(wine_data, aes(x = Flavanoids, y = Phenols, color =factor(Wine))) +geom_point() +labs(title ="Flavanoids vs Phenols by Wine",x ="Flavanoids",y ="Phenols",color ="Wine Class") +theme_minimal()
In the wine industry, flavonoids and phenols play a crucial role. Phenols encompass many components naturally found in plants. Flavonoids, specifically those found in grape skins during the wine production process, contribute color and character to the wine. In the wine industry, particularly in grapes and the wine production process, phenolic and flavonoid components play a significant role. As seen in the graph, the quality of the wine class increases as the values of phenols and flavonoids rise.
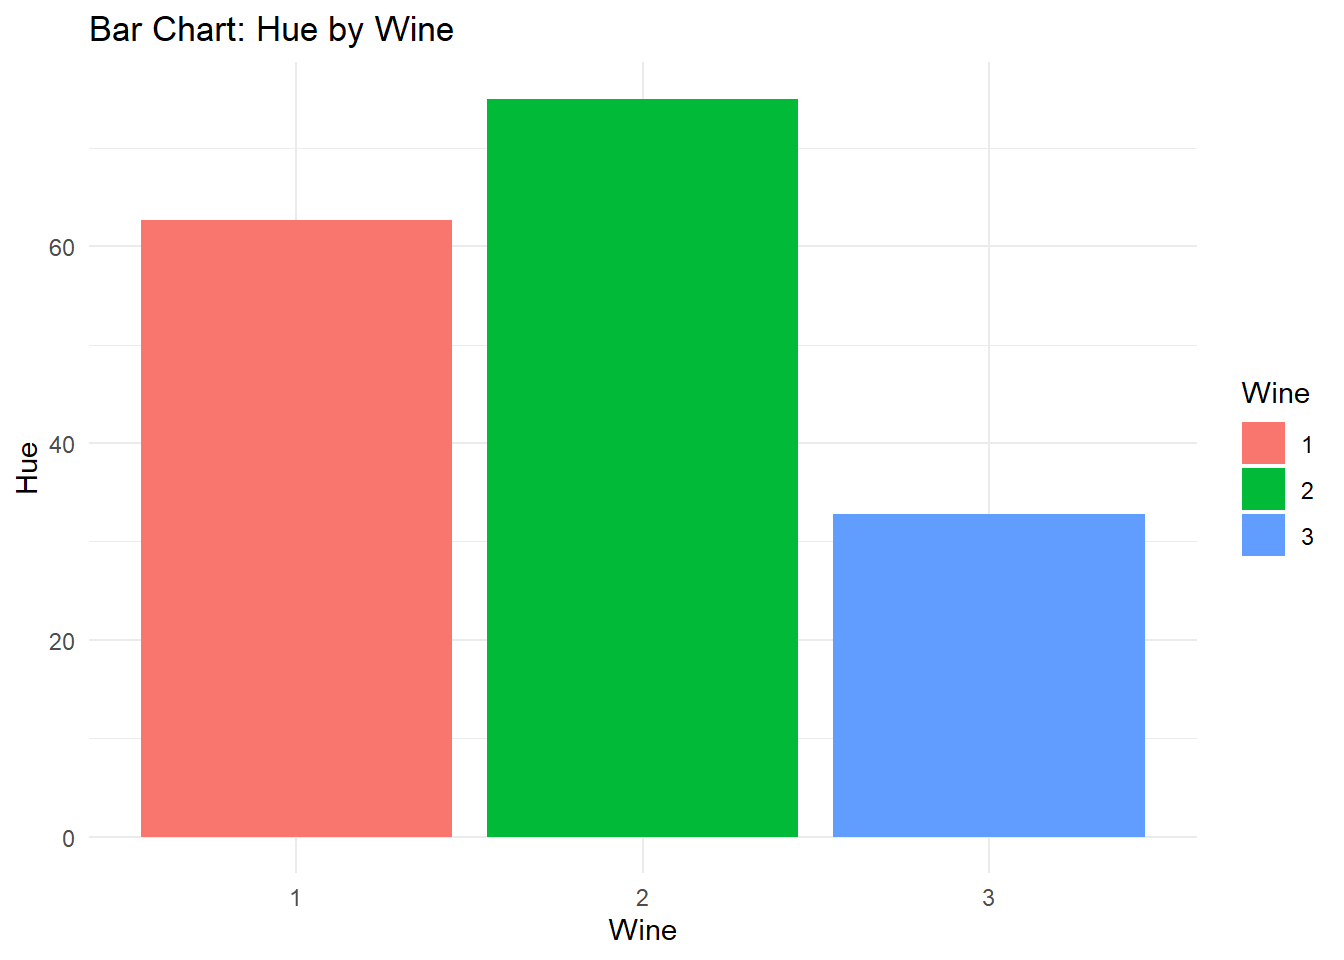
ggplot(wine_data, aes(x =factor(Wine), y = Hue, fill =factor(Wine))) +geom_bar(stat ="identity") +labs(title ="Bar Chart: Hue by Wine",x ="Wine",y ="Hue",fill ="Wine") +theme_minimal()
Hue (Color Tone): It is a measure indicating the color tone of wine, commonly used for red wines, evaluating whether the wine exhibits hues of blue, purple, orange, or red. The color tone can vary depending on factors such as grape variety, ripeness level, and fermentation process. As seen from the graph, wines of good quality tend to have high Hue values