Hello, I’m Melih. I am currently working as a business analyst at Rimteks. I am carrying out a transformation project within the company. On the other hand, I create business continuity plans and follow workflows. We frequently use data sets when schematizing process plans and taking action. In these days when data sets are as valuable as gold for organizations, I aim to improve myself in making data sets useful and get involved in possible job positions. I believe that acting in the light of data science is the most reliable and definitive way.
In this presentation, Richard Vogg talks about how he got help from business partners to use advanced techniques and what can be done to make a data project involving several teams more efficient. He states that what is required for these is that discrete independent operations on data sets can be made more effective when combined and that all tables are related on the way to the final table. He likens this plan to the small melodies in the choir aligning and combining to create a single, loud melody.
In addition, Richard Vogg mentions that a good data generator has the ability to create appropriate data quickly and efficiently, and states that R has many functions and packages that help simulate independent variables and create them in a meaningful way. In other words, it is said that R has the necessary instruments for the single, high melody in the chorus.
4 Propose a Dataset:
This data set includes chemical analysis results of wines belonging to three different classes. It is used to understand classification algorithms or learn data analysis techniques. A 13-dimensional dataset. Additionally, this dataset can also be used to apply classification or regression algorithms, perform data visualization, and evaluate model performance.
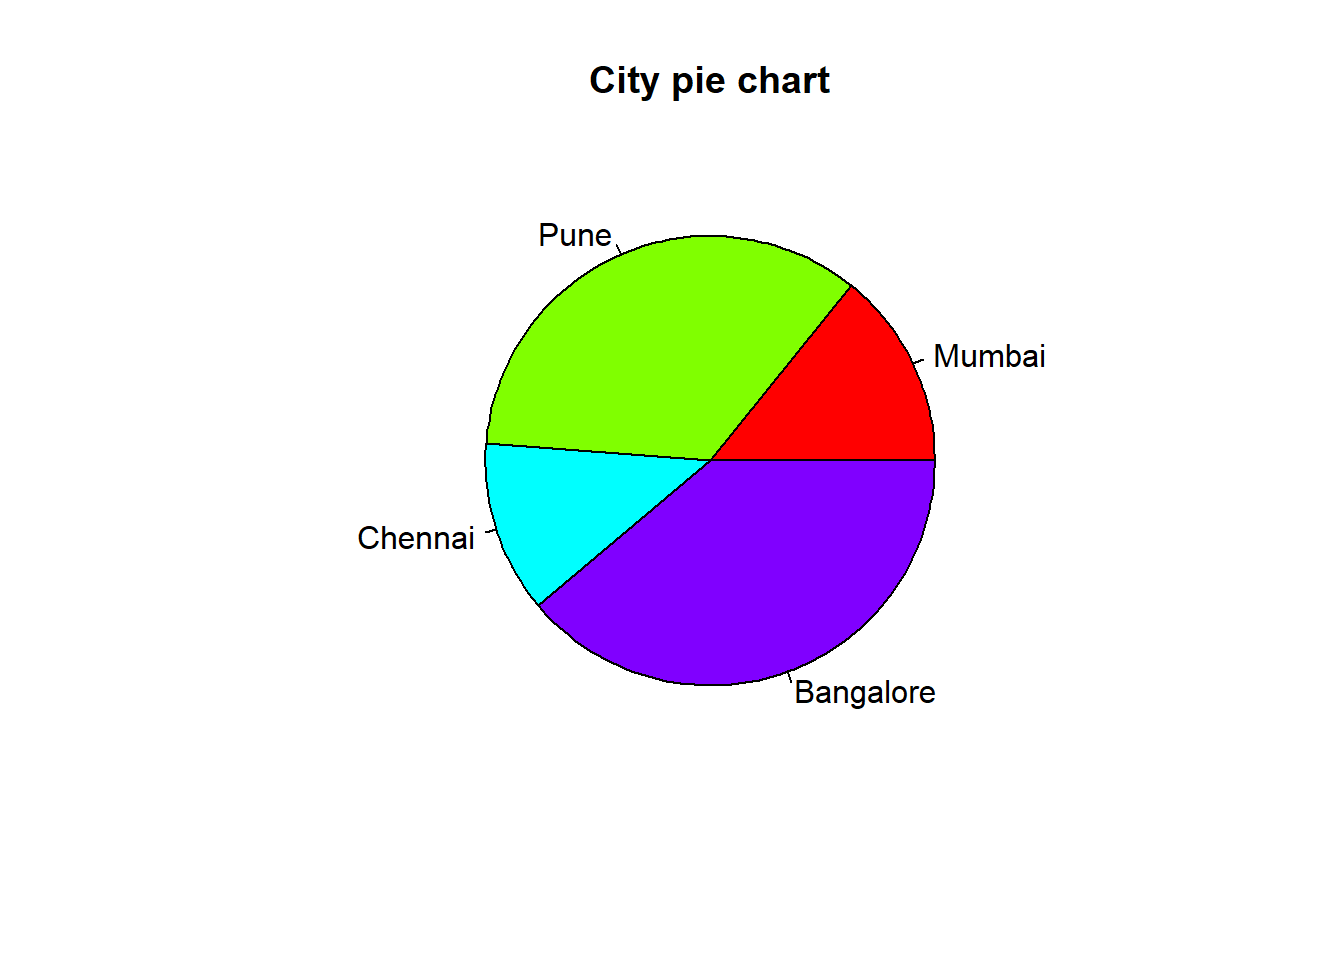
# Create data for the graph.geeks<-c(23, 56, 20, 63)labels <-c("Mumbai", "Pune", "Chennai", "Bangalore")# Plot the chart with title and rainbow # color pallet.pie(geeks, labels, main ="City pie chart",col =rainbow(length(geeks)))
# R program to create a matrixA =matrix(# Taking sequence of elements c(1, 2, 3, 4, 5, 6, 7, 8, 9), # No of rowsnrow =3, # No of columnsncol =3, # By default matrices are in column-wise order# So this parameter decides how to arrange the matrixbyrow =TRUE)# Naming rowsrownames(A) =c("a", "b", "c")# Naming columnscolnames(A) =c("c", "d", "e")cat("The 3x3 matrix:\n")