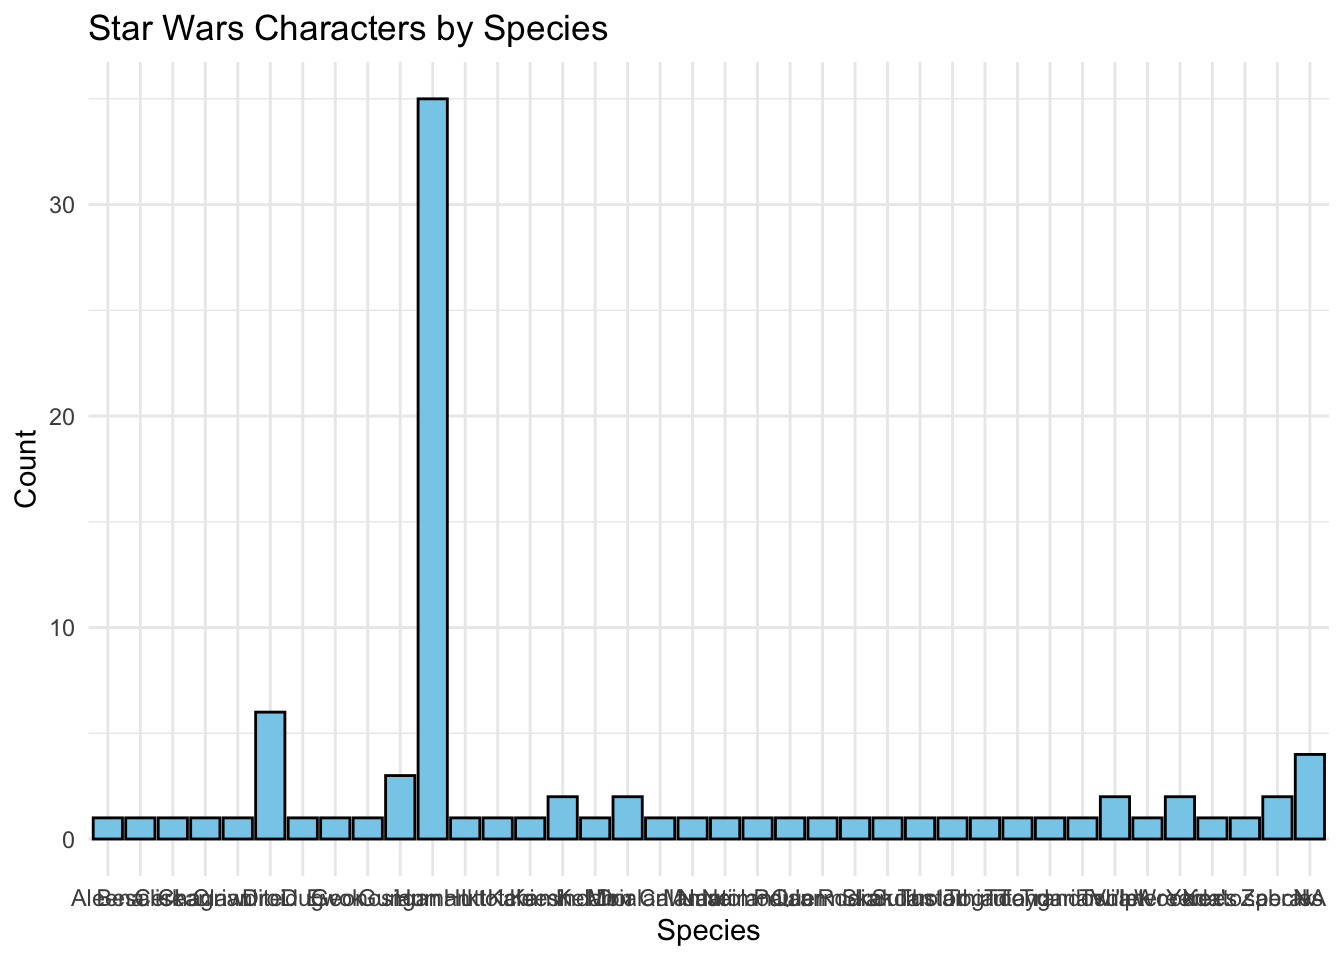
Grafik 1: Irk (species) sayısını gösteren sütun grafiği
library(ggplot2)library(dplyr)
Attaching package: 'dplyr'
The following objects are masked from 'package:stats':

    filter, lag
The following objects are masked from 'package:base':

    intersect, setdiff, setequal, union
species_count <- starwars %>%group_by(species) %>%summarise(count =n())ggplot(species_count, aes(x = species, y = count)) +geom_col(fill ="skyblue", color ="black") +labs(title ="Star Wars Characters by Species", x ="Species", y ="Count") +theme_minimal()
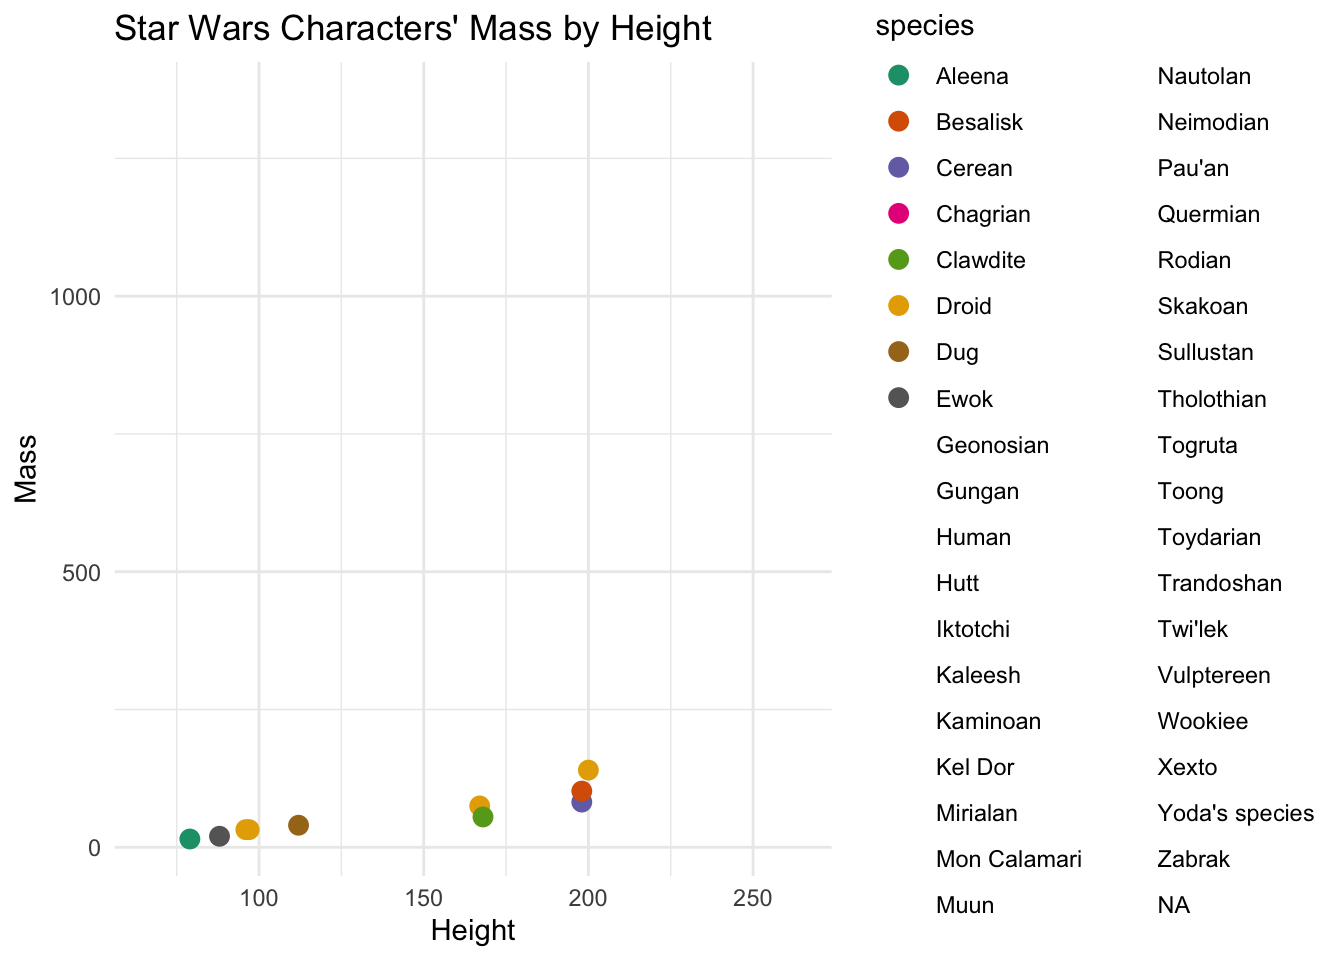
library(ggplot2)data(starwars)# Grafik: Karakterlerin boy uzunluklarına göre ağırlıklarının scatter plot'uggplot(starwars, aes(x = height, y = mass, color = species)) +geom_point(size =3) +labs(title ="Star Wars Characters' Mass by Height", x ="Height", y ="Mass") +scale_color_brewer(palette ="Dark2") +theme_minimal()
Warning in RColorBrewer::brewer.pal(n, pal): n too large, allowed maximum for palette Dark2 is 8
Returning the palette you asked for with that many colors