Hello, this is Burcu! I work as a senior manager at EY, Tax Technology and Transformation service line. I have a very fun and young team of 13 people. We run projects that design processes transforming our clients’ time-consuming tasks with technology. In our projects, we make extensive use of data analytics and robotic process automation tools. I believe that a Master’s program in Big Data Analytics will take my career to the next level. Learning and experiencing new tools can be challenging but also enjoyable!
You can find more about my professional background and connect with me on Linkedin !
This video helped me well for my first intend to implement my quarto assignment. I believe starting with this video will be beneficial.
4 Dataset
Million Song Dataset:
The Million Song Dataset is a comprehensive music dataset containing information on millions of songs. It includes a range of musical features for each song, such as tempo, key, vocal content, danceability, and more. Additionally, it provides details about the song, artist, album, and music genre.
Key Features:
Song title
Artist name
Album name
Song duration
Key
Tempo
Vocal content
Danceability
Energy level
Acousticness level
Instrumentalness level
Music genre
Data Source: The Million Song Dataset was created by The Echo Nest and is hosted at Columbia University. This dataset is publicly available for research and educational purposes.
Access: For access to the Million Song Dataset and more detailed information, you can visit the official website.
This dataset is suitable for analyzing music genres, classifying songs, learning about music, or enhancing your data science skills in an educational project. You can find detailed information and access instructions on the official website linked above.
5 R Posting
5.1Calculating Mean, Median, and Standard Deviation:
# Create a numeric vectordata <-c(12, 18, 25, 32, 45, 54, 63)# Calculate the mean, median, and standard deviationmean_value <-mean(data)median_value <-median(data)std_dev <-sd(data)# Print the resultscat("Mean:", mean_value, "\n")
Mean: 35.57143
cat("Median:", median_value, "\n")
Median: 32
cat("Standard Deviation:", std_dev, "\n")
Standard Deviation: 19.01628
This code calculates the mean, median, and standard deviation of a numeric vector data.
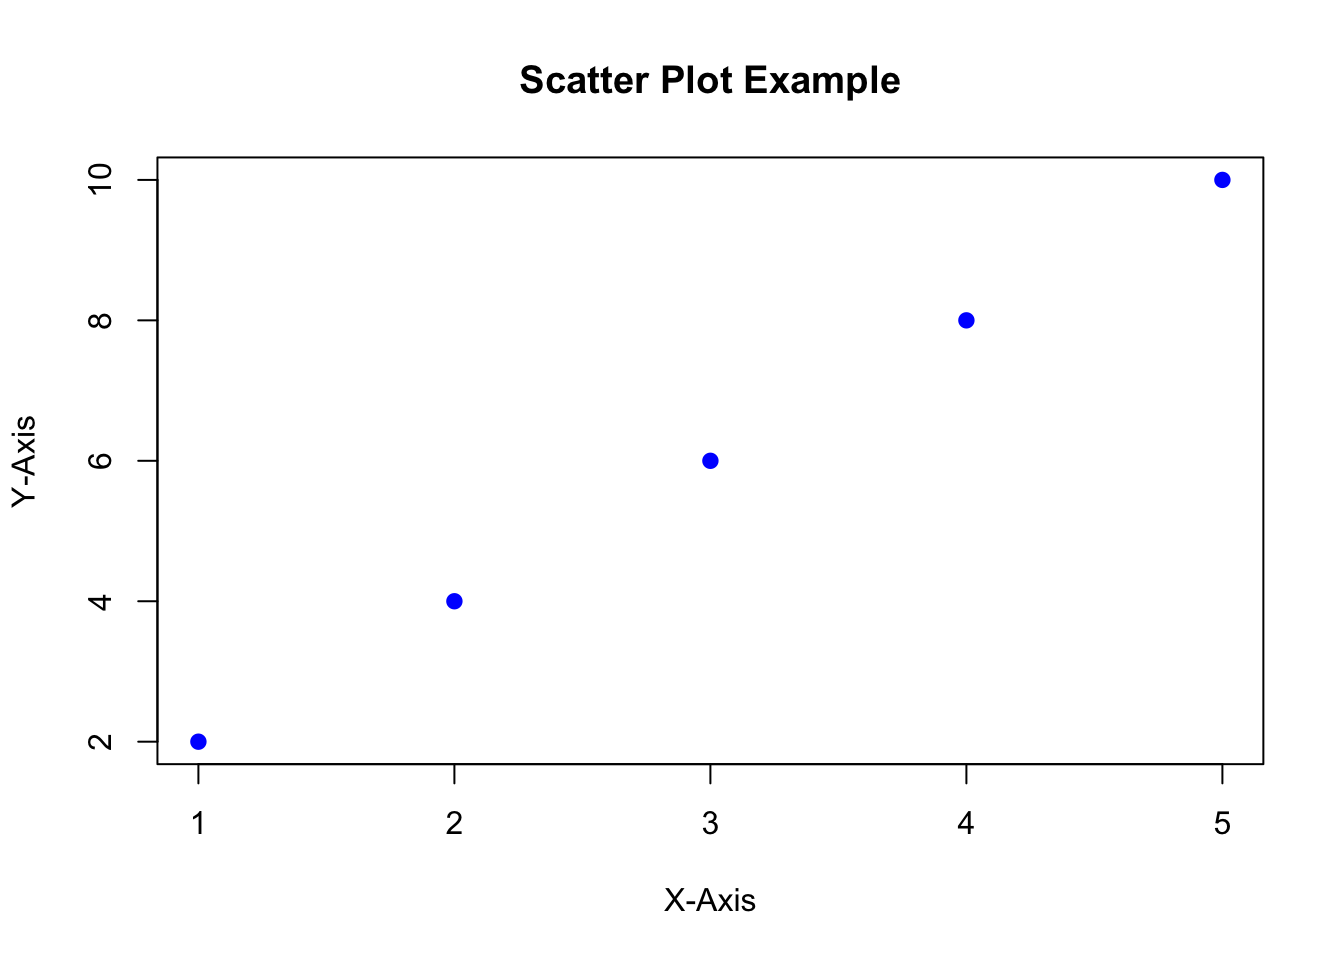
5.2Creating and Plotting a Scatter Plot:
# Create example datax <-c(1, 2, 3, 4, 5)y <-c(2, 4, 6, 8, 10)# Create a scatter plotplot(x, y, main ="Scatter Plot Example", xlab ="X-Axis", ylab ="Y-Axis", pch =19, col ="blue")
This code creates a simple scatter plot using the plot function.
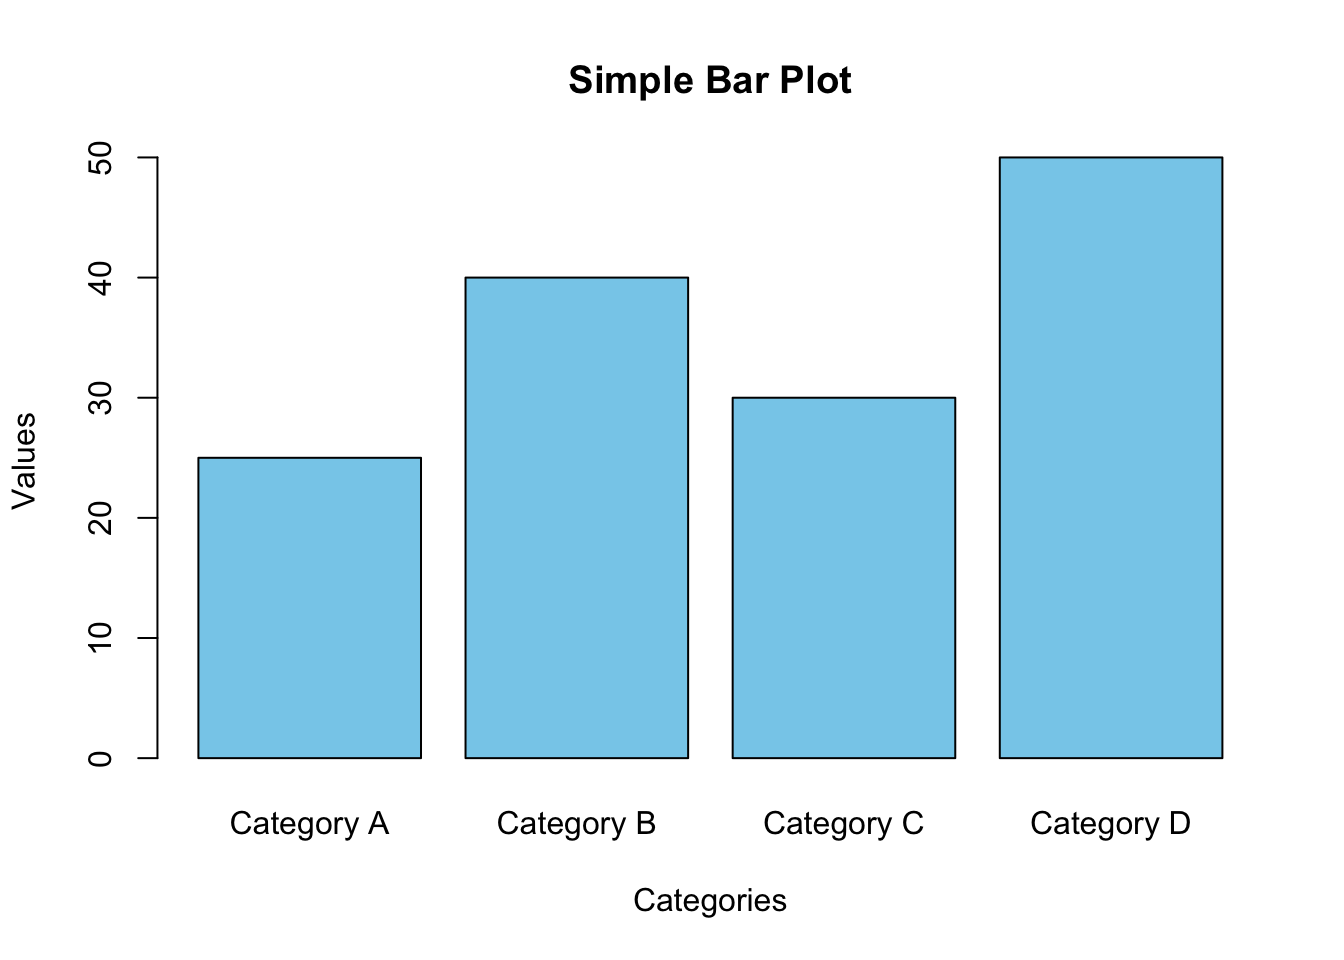
5.3Creating a Bar Plot:
# Sample datacategories <-c("Category A", "Category B", "Category C", "Category D")values <-c(25, 40, 30, 50)# Create a bar plotbarplot(values, names.arg = categories, main ="Simple Bar Plot", xlab ="Categories", ylab ="Values", col ="skyblue")
In this example, there is a vector of category names and their corresponding values. The code creates a basic bar plot using the barplot function, showing the distribution of values across the categories. You can modify the categories and values vectors to represent your own data for this bar plot.