1 STARTUPS 2021
In this report, we will explore the data set of start-ups getting investments from a variety of domestic and international investors. Data is gathered from KPMG and 212’s Turkish Startup Investments Review 2021 report.
KEY TAKEAWAYS OF THE REPORT
- In the seed stage, Gaming sector has the lead, in the acquistion sector, SaaS is the leader sector
- Gaming is winner of number of investment category, but if we look at total deals Ecommerce Enabler sector is winner. This is possibly due to the trendyol,hepsiburada investments which are outliers of this category. Delivery & Logistic sector is also ahead of Gaming, this is also due to the getir, which is also a outlier in terms of deal amount.
- Getir also stands out as a start-up that gets investments more than one stage (Later VC Stage, Early VC Stage) and more than once in 2021. Servislet is another start-up that getting investments both Seed Stage and Early VC Stage stage in 2021. These two start-ups draw attention with their rapid growth in 1 year.
- Gaming sector has the highest number of investors
- Agritech sector is the most multi-cultural sector in terms of different number of investor origins in one deal
- Most of the investments made in December and August, and the most quite months are May and October, as quarters, number of total investments are increasing in Q3,Q4 if we compare Q1 and Q2.
- Fintech startups’ 73% of investments coming from Financial Investors. Interestingly, 86% of Delivery & Logistics investments and 78% of Healthtech investments coming from Financial Investors which are greater than Fintech.
- Seed-Stage is mostly invested by Financial investors. This may be due to financial investors’ willing to invest in the beginning of the start-ups to get more profit.
DATA PREPROCESSING
Call necessary libraries
Show the code
#install.packages("readxl")
library(readxl)
library(lubridate)
library(dplyr)
library(tidyverse)
library(ggplot2)
Load the data
Show the code
data = read_excel("data//startup_deals_2021.xlsx")Rename the column names
Show the code
data <- data %>%
  rename(Stage = 'Investment Stage',
         Company = 'Target Company',
         DealValue = 'Deal Value (USD)',
         Financial = 'Financial Investor',
         Date = 'Announcement Date',
         Origin ="Investor's Origin",
         Stake = "Stake (%)"
  )
colnames(data)
[1] "Company" "Sector" "Investor" "Date" "Financial" "Origin"
[7] "Stake" "DealValue" "Stage" - Convert “Deal Value (USD)” type to numeric data
- Convert Date column to date type, and drop year 2021, since all date values have same year, 2021
- Drop % sign for Stake, and convert to numeric data type
Show the code
options(scipen=999)
data$DealValue <- suppressWarnings(as.numeric(data$DealValue))

data$Date <- my(data$Date)


data <- data %>%
  mutate(Stake = str_replace_all(Stake, "%", ""))
data$Stake <- suppressWarnings(as.numeric(data$Stake))
sapply(data, class)
Company Sector Investor Date Financial Origin
"character" "character" "character" "Date" "character" "character"
Stake DealValue Stage
"numeric" "numeric" "character" Sector feature has inconsistent values like Diğital Comparison, Artificial intelligence, Cybersec urity, Telecpm, Artificial Intelligence, B lockchain.
Show the code
data_incons <- data %>%
  filter(Sector %in% c('Diğital Comparison',
'Artificial intelligence',
'Cybersec urity',
'Telecpm',
'Artificial Intelligence',
'B lockchain'
))
unique(data_incons$Sector)
[1] "Artificial Intelligence" "Artificial intelligence"
[3] "B lockchain" "Diğital Comparison"
[5] "Cybersec urity" "Telecpm" Inconsistent Sector values are updated with the right values.
Show the code
data$Sector[data$Sector == 'Artificial intelligence'] <- 'Artificial Intelligence'
data$Sector[data$Sector == 'Telecpm'] <- 'Telecom'
data$Sector[data$Sector == 'B lockchain'] <- 'Blockchain'
data$Sector[data$Sector == 'Diğital '] <- 'Dijital'
data$Sector[data$Sector == 'Cybersec urity '] <- 'Cybersecurity'
data$Sector[data$Sector == 'Ecommerce enabler'] <- 'Ecommerce Enabler'
data$Sector[data$Sector == 'I mage process'] <- 'Image process'
data$Sector[data$Sector == 'Ecommerce enabler'] <- 'Ecommerce Enabler'
data$Sector[data$Sector == 'Data analytics'] <- 'Data Analytics'
Now the data is ready for the EDA,
Show the code
knitr::kable(head(data))| Company | Sector | Investor | Date | Financial | Origin | Stake | DealValue | Stage |
|---|---|---|---|---|---|---|---|---|
| Abonesepeti | SaaS | Keiretsu Forum, Berkan Burla | 2021-06-01 | Yes | Turkey | 5 | 100000 | Seed Stage |
| Abrakadabra | Gaming | WePlay Ventures | 2021-12-01 | Yes | Turkey | 5 | 250000 | Seed Stage |
| Ace Games | Gaming | Actera Group, NFX, Kristian Segerstrale, Alexis Bonte, Kaan Günay (Private Investors) | 2021-04-01 | Yes | Turkey, USA | NA | NA | Seed Stage |
| Adlema | Internet of things | TR Angels | 2021-06-01 | Yes | Turkey | NA | 120000 | Seed Stage |
| Agave Games | Gaming | 500 Istanbul (Fund II), Akin Babayiğit (Private Investor) | 2021-09-01 | Yes | Turkey | NA | 100000 | Seed Stage |
| Agrio | Fintech | lnnovate21st.com | 2021-06-01 | Yes | Turkey | NA | 1000000 | Seed Stage |
EXPLORATORY DATA ANALYSIS
Gaming is a good start!
If we look at the number of deals Gaming sector is at the top in Seed stage and also in all stages!
Show the code
df <- data %>%
  group_by(Sector) %>%
  summarise(TotalNumberofDeals=n()) %>%
  top_n(n=10)
ggplot(data=df, aes(x=Sector, y=TotalNumberofDeals)) +
  geom_bar(position="dodge",stat="identity") +
  ggtitle("Number of Deals vs Sectors (Top 10)")+
  theme(axis.text.x = element_text(angle = 45))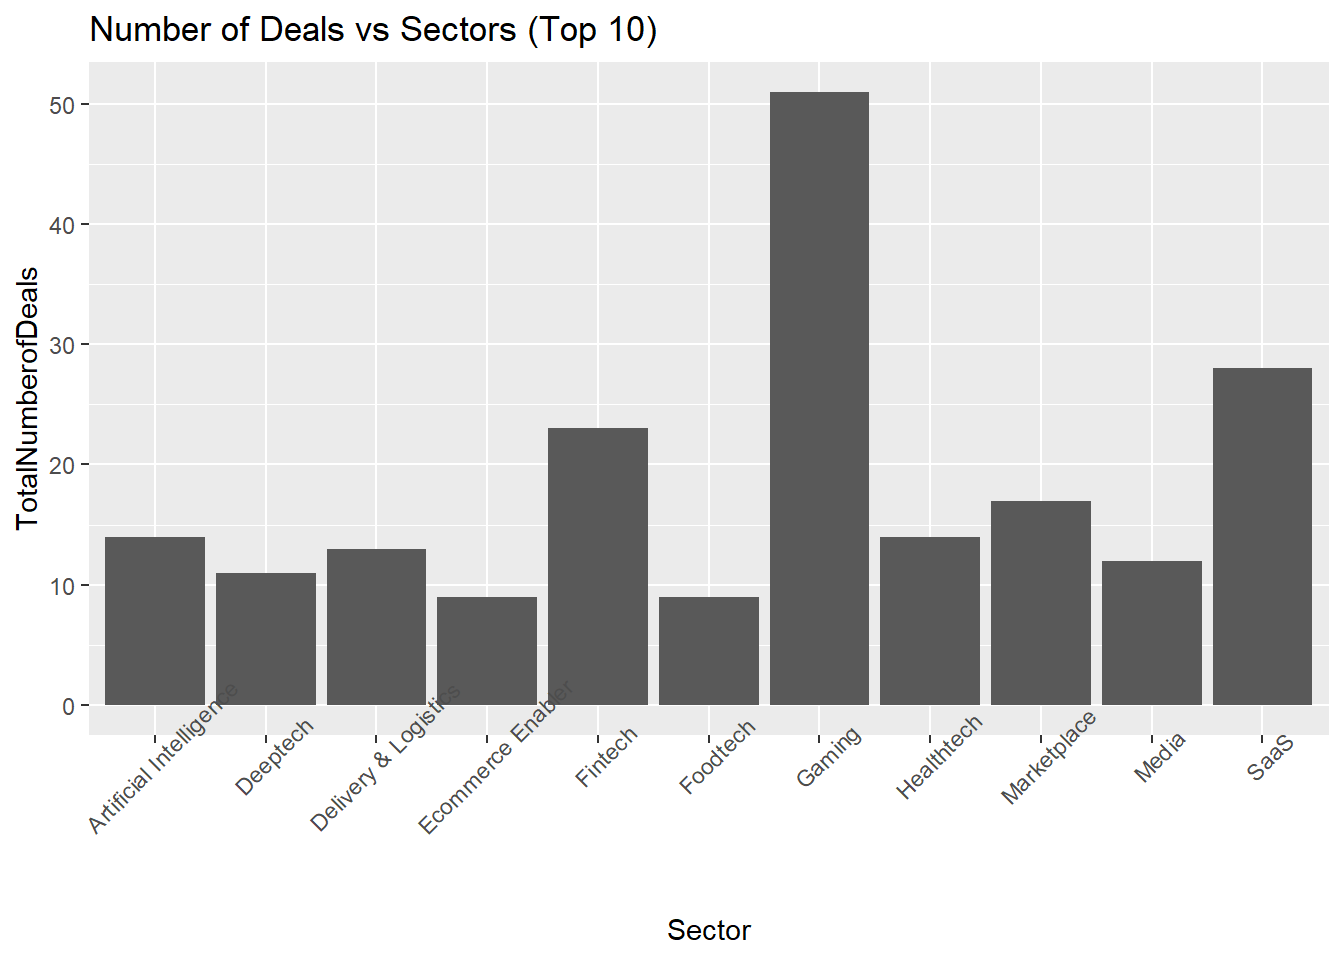
Show the code
sector_stage <- data %>%
  group_by(Stage,Sector) %>%
  summarise(Total = n()) %>%
  arrange(desc(Total)) %>%
  slice_max(Total,n=3)
knitr::kable(sector_stage)| Stage | Sector | Total |
|---|---|---|
| Acquisition | SaaS | 10 |
| Acquisition | Gaming | 5 |
| Acquisition | Fintech | 4 |
| Early VC Stage | Fintech | 3 |
| Early VC Stage | Ecommerce Enabler | 2 |
| Early VC Stage | Foodtech | 2 |
| Early VC Stage | Gaming | 2 |
| Later VC Stage | Delivery & Logistics | 3 |
| Seed Stage | Gaming | 44 |
| Seed Stage | SaaS | 17 |
| Seed Stage | Fintech | 16 |
Show the code
ggplot(data=sector_stage, aes(x=Stage, y=Total, fill=factor(Sector))) +
  geom_bar(position="dodge",stat="identity") +
  ggtitle("Investment Stage and Investment Sectors")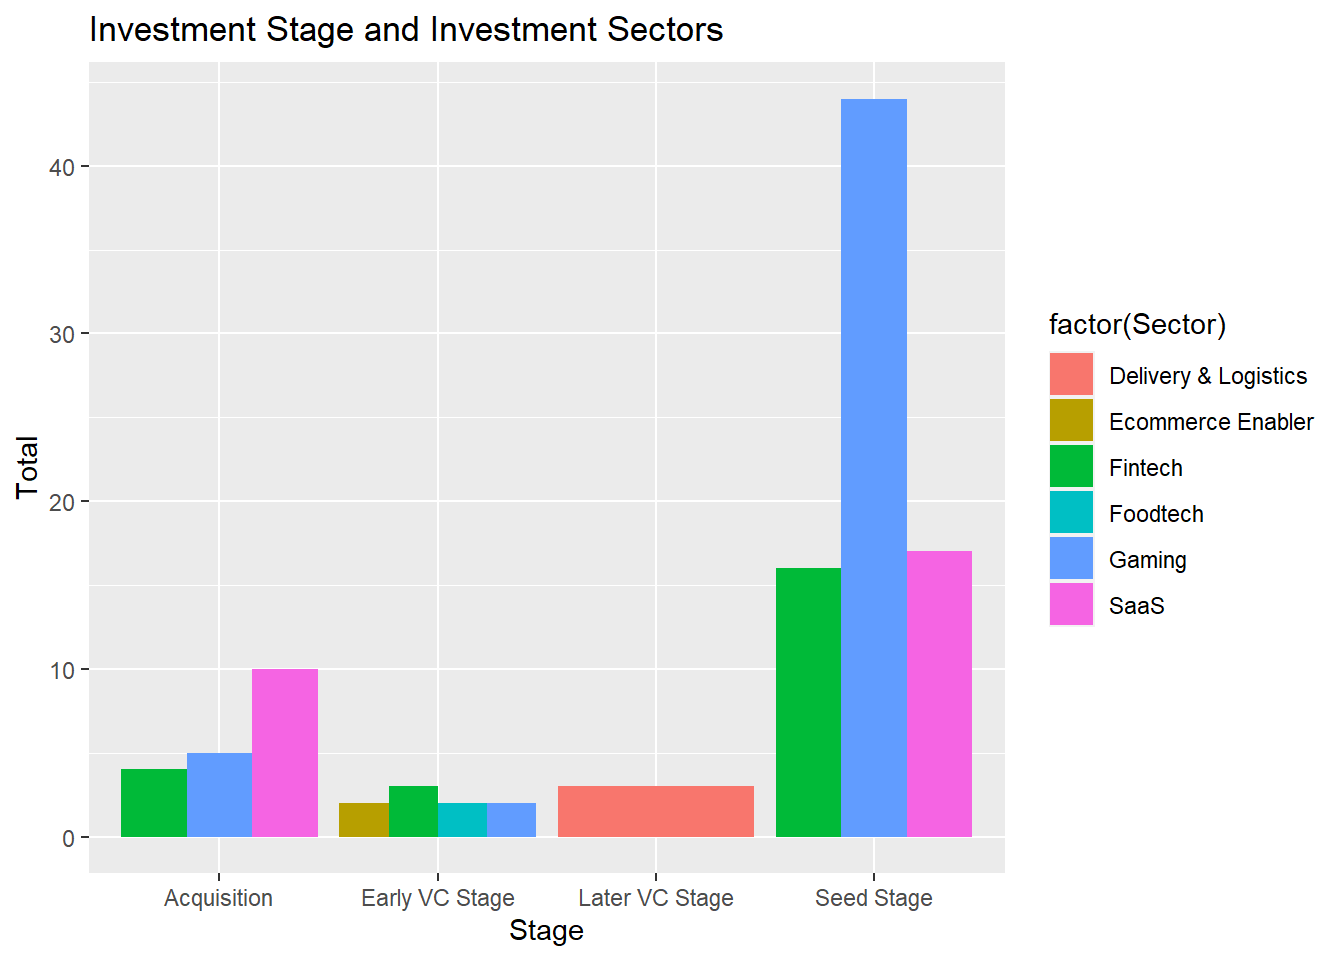
Deal Amounts: A General Look
Ecommerce Enabler is the winning sector if we look at the Total Deal Value(USD).
Show the code
df1 <-  data %>%
  mutate(TotalDeal = sum(DealValue,na.rm = TRUE))


df2 <- df1 %>%
  group_by(Sector) %>%
  summarise(RateOfDeal=(sum(DealValue,na.rm = TRUE)/TotalDeal)*100) %>%
  arrange(desc(RateOfDeal))


knitr::kable(head(unique(df2)))| Sector | RateOfDeal |
|---|---|
| Ecommerce Enabler | 58.7822478 |
| Delivery & Logistics | 27.1997590 |
| Gaming | 5.8547176 |
| SaaS | 2.2243645 |
| Fintech | 0.7646592 |
| Marketplace | 0.7006893 |
Show the code
df3 <- df2 %>% filter(RateOfDeal>1)
df3 <- unique(df3)
ggplot(df3, aes(x="Sector", y=RateOfDeal, fill=Sector))+
geom_bar(width = 1, stat = "identity") +
  ggtitle("Deal(USD) Rates of Sectors (greater than 1%)")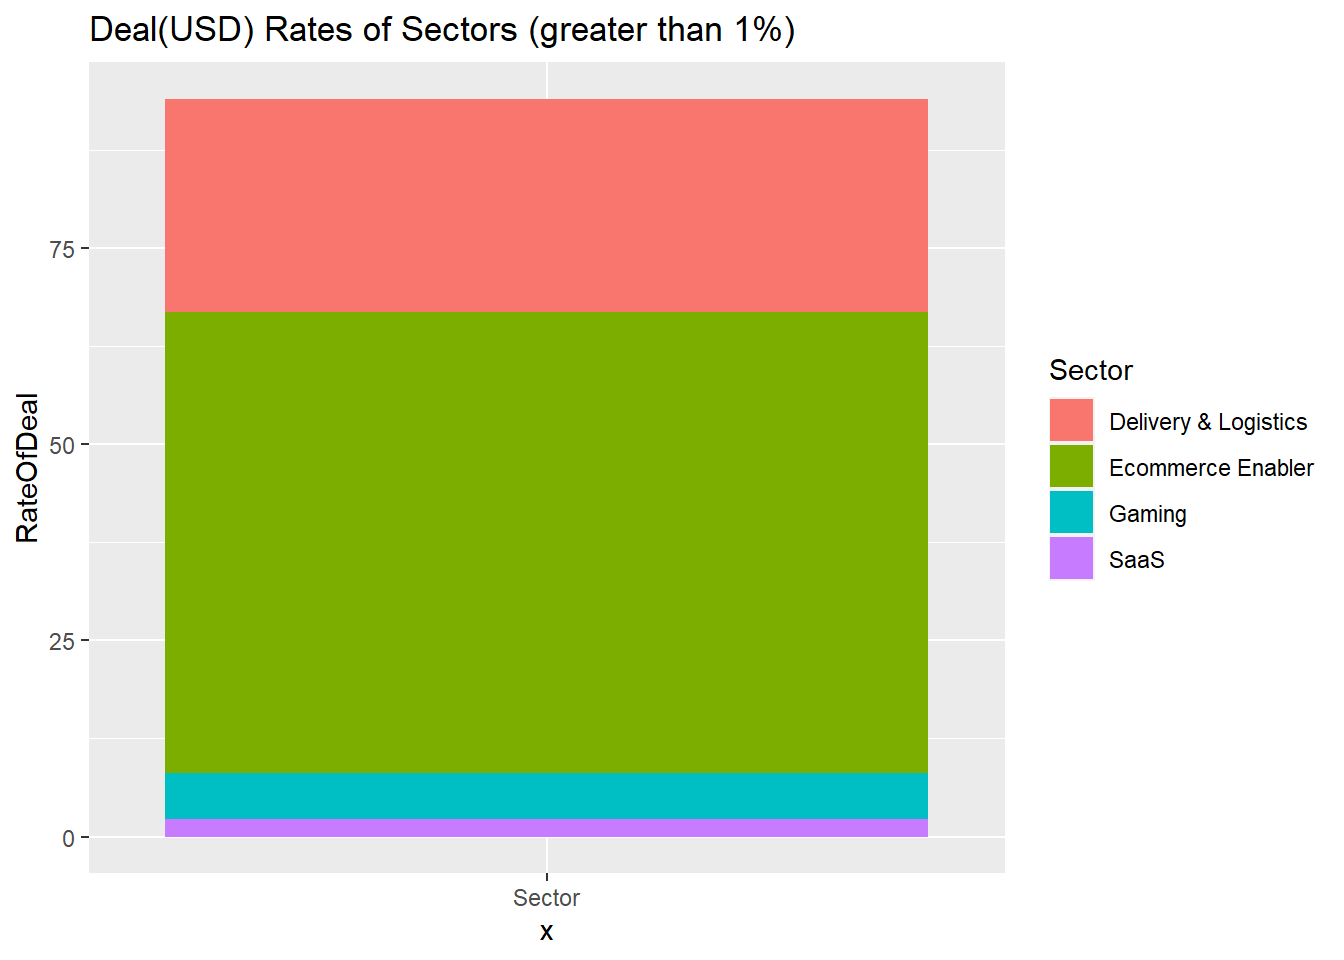
Deal Amounts: Who makes the difference?
Gaming has the lead at number of deals, but e-commerce enablers sector is at the top of deal amounts. So, Deal Value category is investigated with a boxplot.
Show the code
df <-  data %>%
  group_by(Company,Sector) %>%
  summarise(Total=n(),TotalDealValue=sum(DealValue))  %>%
  arrange(desc(TotalDealValue))
ggplot(df) +
  aes(x = "", y = log(TotalDealValue)) +
  geom_boxplot(fill = "#0c4c8a") +
  theme_minimal()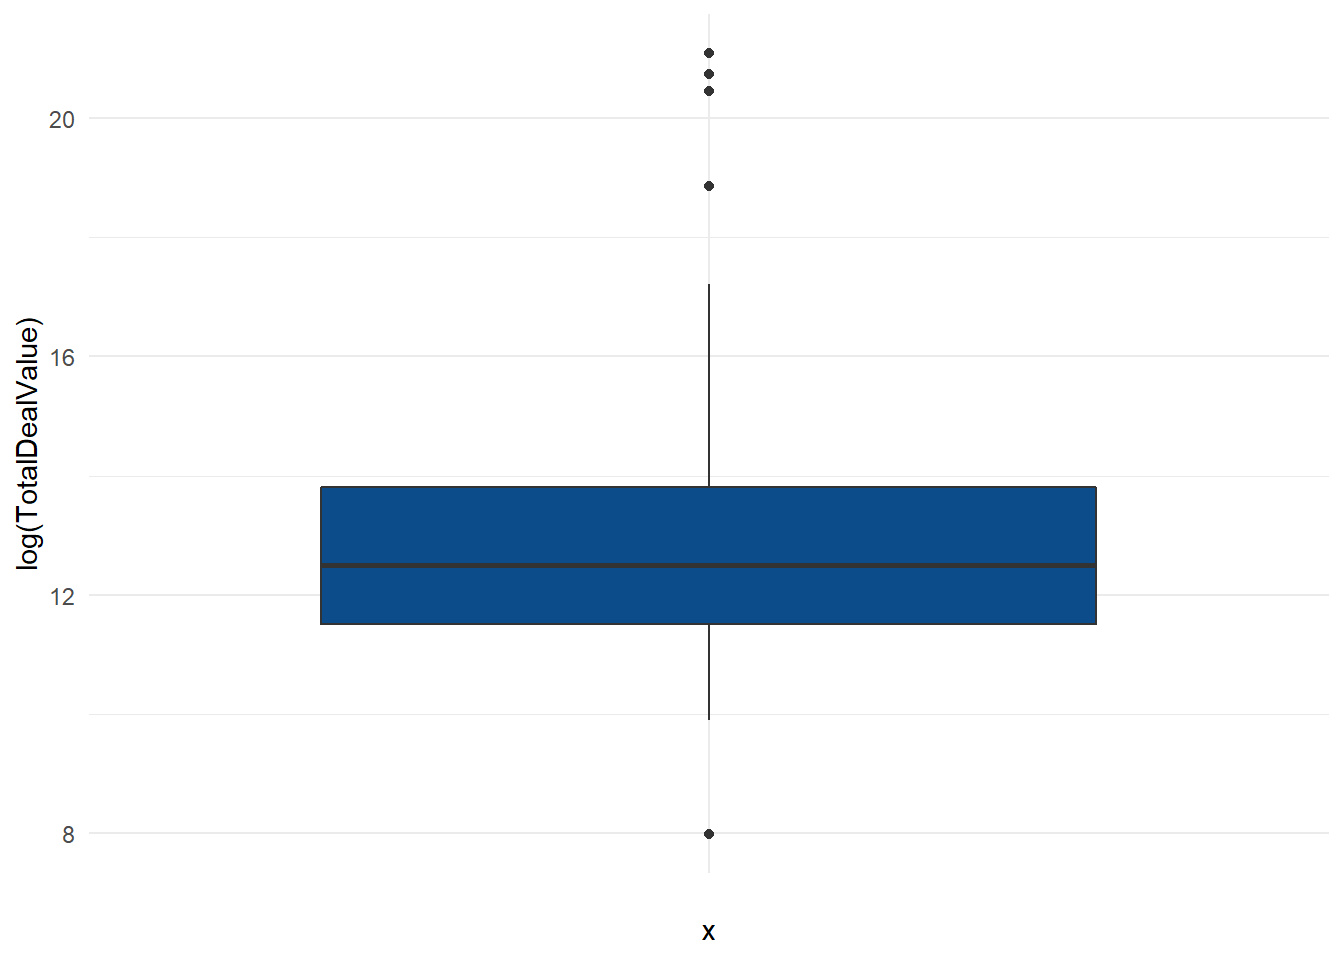
There are upper outliers and a 1 lower outlier. Let’s look deeper at the upper outlier, to see which companies make the difference.
Which companies make the difference?
Show the code
lower_bound <- quantile(df$TotalDealValue, 0.01,na.rm = TRUE)
upper_bound <- quantile(df$TotalDealValue, 0.99,na.rm = TRUE)

upper_outlier_ind <- which(df$TotalDealValue > upper_bound)


knitr::kable(df[upper_outlier_ind, ],caption = "Companies Making Difference")| Company | Sector | Total | TotalDealValue |
|---|---|---|---|
| trendyol | Ecommerce Enabler | 1 | 1435000000 |
| Getir | Delivery & Logistics | 4 | 1018000000 |
| hepsiburada | Ecommerce Enabler | 1 | 761481000 |
Companies which were invested in different stages
Show the code
Stage_v1 <- data %>% group_by(Company,Stage) %>%
  summarise(Investment_Count = n(),
  TotalDealValue=sum(DealValue)
  )

Stage_v2 <- Stage_v1 %>% group_by(Company) %>%
  summarise(StageCount = n()) %>%
  filter(StageCount>1)

Morethanonestage <-data %>%
                    select(Company,Sector,DealValue,Date,Stage) %>%
                    filter(Company %in% Stage_v2$Company)

knitr::kable(Morethanonestage,caption = "Companies which invested in different stages")| Company | Sector | DealValue | Date | Stage |
|---|---|---|---|---|
| Getir | Delivery & Logistics | 555000000 | 2021-06-01 | Later VC Stage |
| Getir | Delivery & Logistics | 300000000 | 2021-03-01 | Later VC Stage |
| Getir | Delivery & Logistics | 128000000 | 2021-01-01 | Early VC Stage |
| Getir | Delivery & Logistics | 35000000 | 2021-08-01 | Later VC Stage |
| Servislet | Marketplace | 12000000 | 2021-12-01 | Early VC Stage |
| Servislet | Marketplace | 500000 | 2021-07-01 | Seed Stage |
Investors
If we look at the number of investors, Gaming is also winner for this category. Investor Numbers by Sectors
Show the code
data_investor <- mutate(data,
       investor_number = sapply(strsplit(as.character(data$Investor), ","), length))

investor_gg <- data_investor %>%
  group_by(Sector) %>%
  summarise(TotalNumberInvestor=sum(investor_number))  %>%
  arrange(desc(TotalNumberInvestor)) %>%
  slice_max(TotalNumberInvestor,n=10)

ggplot(data=investor_gg, aes(x=Sector, y=TotalNumberInvestor)) +
  geom_bar(position="dodge",stat="identity") +
  ggtitle("Number of Investors by Sectors") +
  theme(axis.text.x = element_text(angle = 90))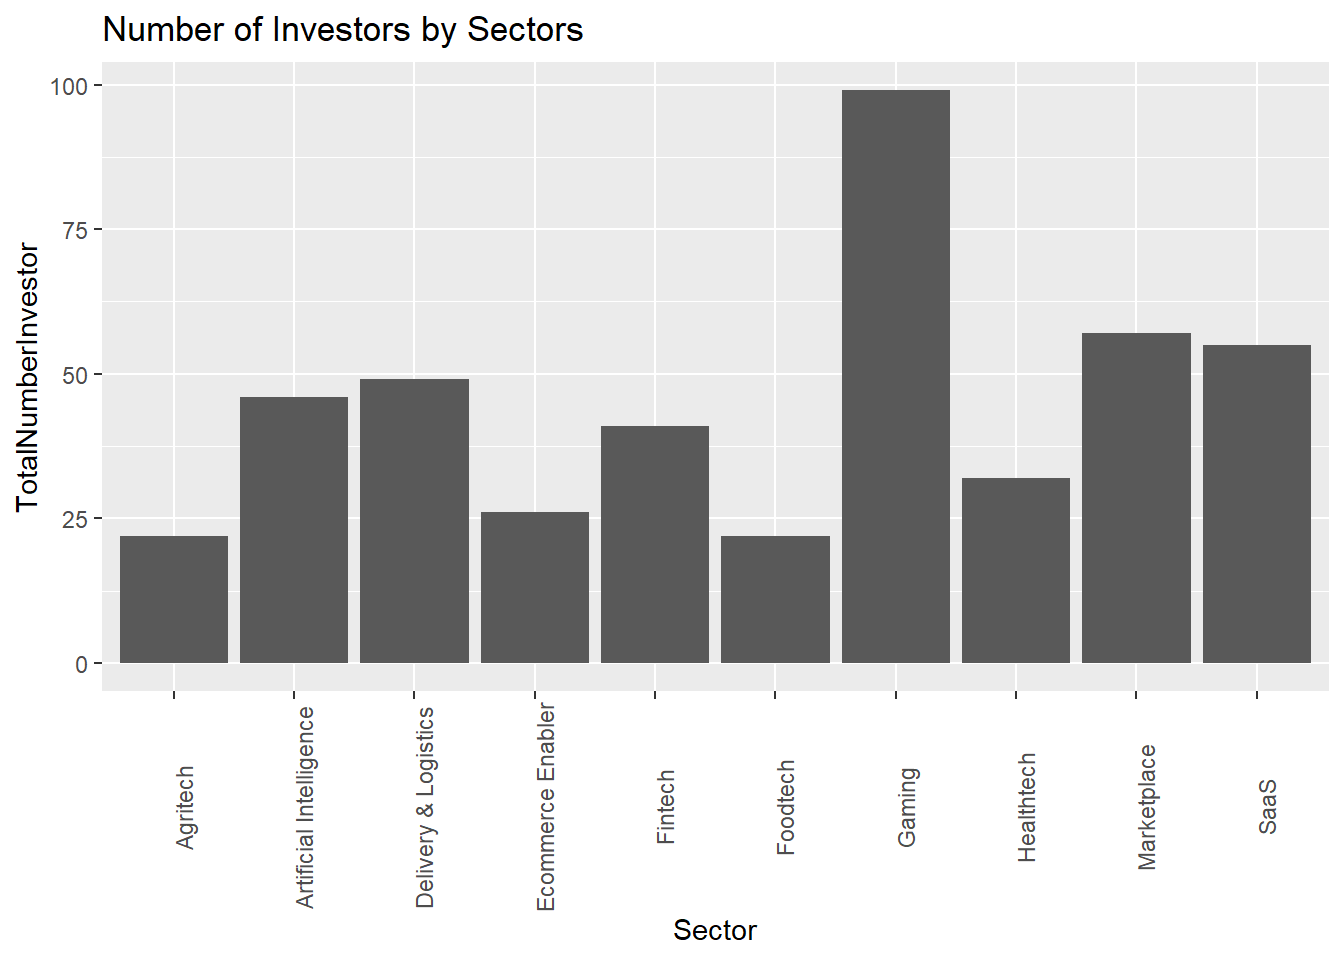
Investor Numbers by Origins : Most Multi-cultural Sector : Agritech
Agritech sector is the most multi-cultural sector in terms of different number of investor origins in one deal
Show the code
data_inv_origin <- mutate(data,
       origin_number = sapply(strsplit(as.character(data$Origin), ","), length))

inv_or_sec <- data_inv_origin %>%
  group_by(Sector) %>%
  summarise(MaxOriginNumber = max(origin_number),MeanOriginNumber = mean(origin_number)) %>%
  filter(MaxOriginNumber>1) %>%
  arrange(desc(MaxOriginNumber)) %>%
  top_n(5)


knitr::kable(inv_or_sec)| Sector | MaxOriginNumber | MeanOriginNumber |
|---|---|---|
| Agritech | 5 | 1.625000 |
| Ecommerce Enabler | 4 | 1.666667 |
| Delivery & Logistics | 3 | 1.307692 |
| Advertising | 2 | 1.500000 |
| Foodtech | 2 | 1.222222 |
Investors: Financial or Non-Financial?
Fintech startups’ 73% of investments coming from Financial Investors. Interestingly, 86% of Delivery & Logistics investments and 78% of Healthtech investments coming from Financial Investors which are greater than Fintech.
Show the code
df1 <- data %>%
  group_by(Sector) %>%
  summarise(
    Total = n(),
    Financial = sum(Financial == "Yes")
  ) %>%
  mutate(FinancialInvestorPercentage =(Financial/Total)*100 ) %>%
  filter(Total>1) %>%
  arrange(desc(Financial),desc(FinancialInvestorPercentage))

knitr::kable(head(df1,10))| Sector | Total | Financial | FinancialInvestorPercentage |
|---|---|---|---|
| Gaming | 51 | 27 | 52.94118 |
| SaaS | 28 | 19 | 67.85714 |
| Fintech | 23 | 17 | 73.91304 |
| Delivery & Logistics | 13 | 11 | 84.61538 |
| Healthtech | 14 | 11 | 78.57143 |
| Marketplace | 17 | 11 | 64.70588 |
| Artificial Intelligence | 14 | 9 | 64.28571 |
| Ecommerce Enabler | 9 | 7 | 77.77778 |
| Foodtech | 9 | 7 | 77.77778 |
| Biotech | 6 | 6 | 100.00000 |
When the investments take place most?
Total number of deals are increasing in Q3,Q4 if we compare Q1 and Q2.
Show the code
df <-  data %>%
  mutate(Month = month(data$Date, label=TRUE)) %>%
  mutate(Quarter = paste("2021 Q", quarter(data$Date)))  %>%
  group_by(Quarter) %>%
  summarise(Total=n())%>%
  arrange(Quarter)

ggplot(data=df, aes(x=Quarter, y=Total, group=1)) +
  geom_line()+
  geom_point() +
  ylim(0,100) +
  ggtitle("Number of Investments Quarters - 2021")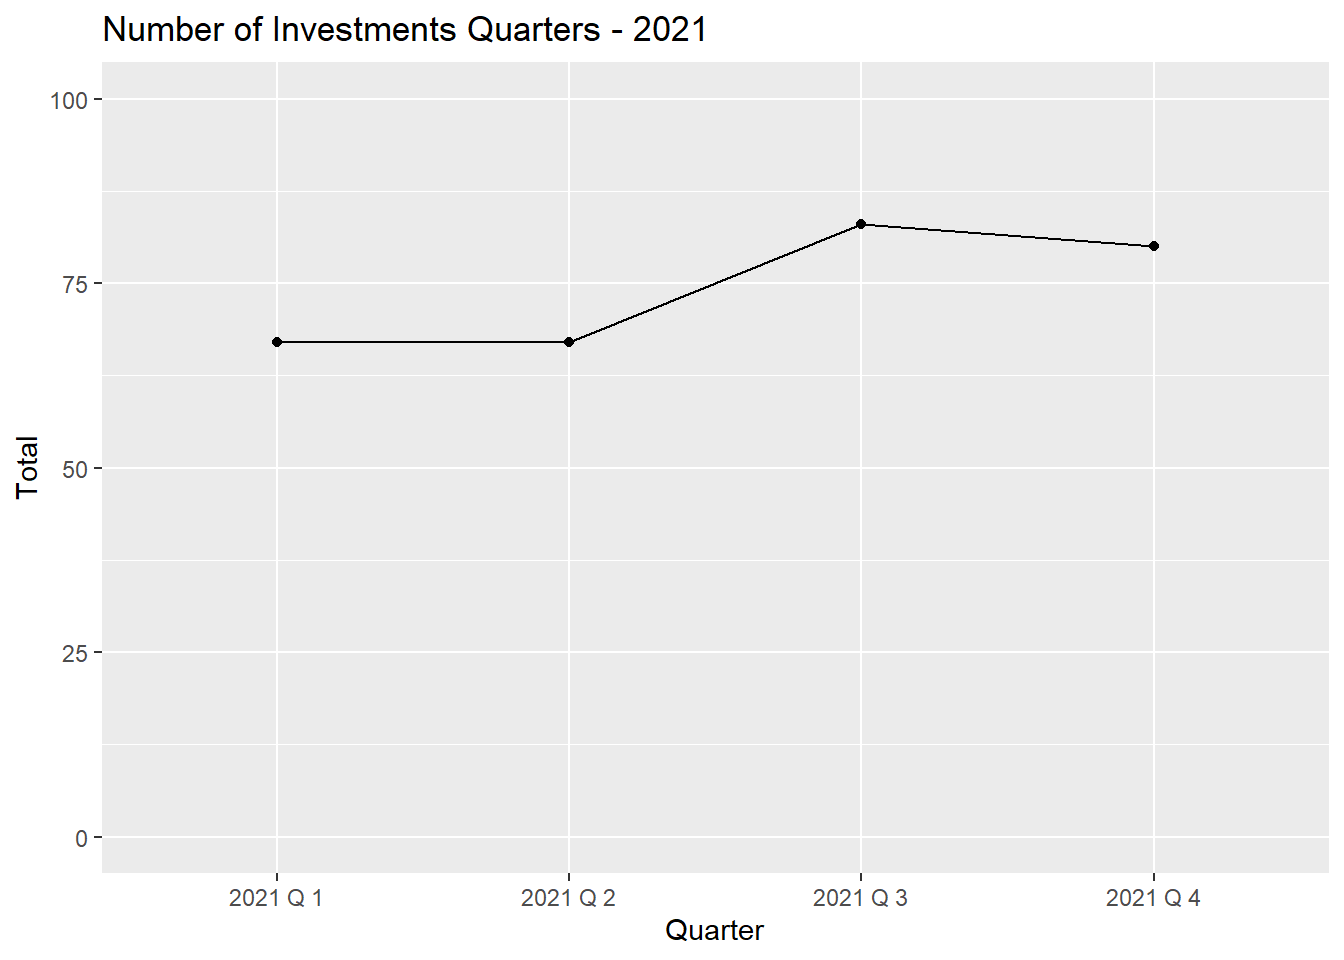
Most of the investments made in December and August, and the most quite months are May and October.
Show the code
df1 <-  data %>%
  mutate(Month = month(data$Date, label=TRUE)) %>%
  group_by(Month) %>%
  summarise(Total=n())%>%
  arrange(Month)

ggplot(data=df1, aes(x=Month, y=Total, group=1)) +
  geom_line()+
  geom_point() +
  ylim(0,100) +
  ggtitle("Number of Investments Monthly - 2021")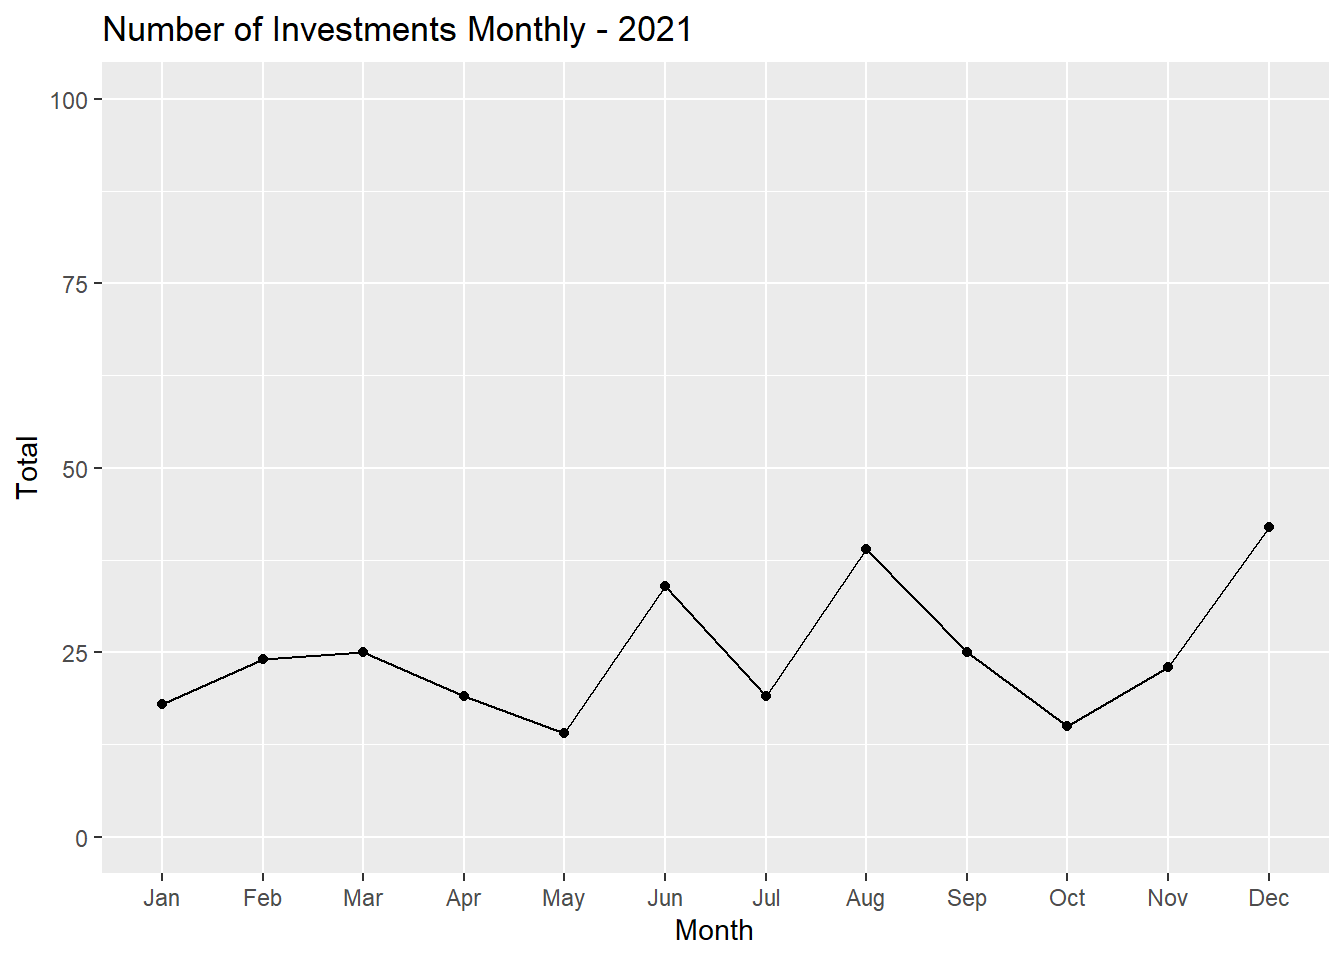
Which state to invest? Non-financial and financial investors
We can say that Seed Stage has been mostly invested by Financial investors and Acquisition stage mostly invested by Non-Financial investors.
Show the code
  ggplot(data,aes(x = Stage, y=Sector, fill = Financial)) +
    geom_dotplot(binaxis = "y", stackdir = "center",
                 dotsize=1,binwidth = 1)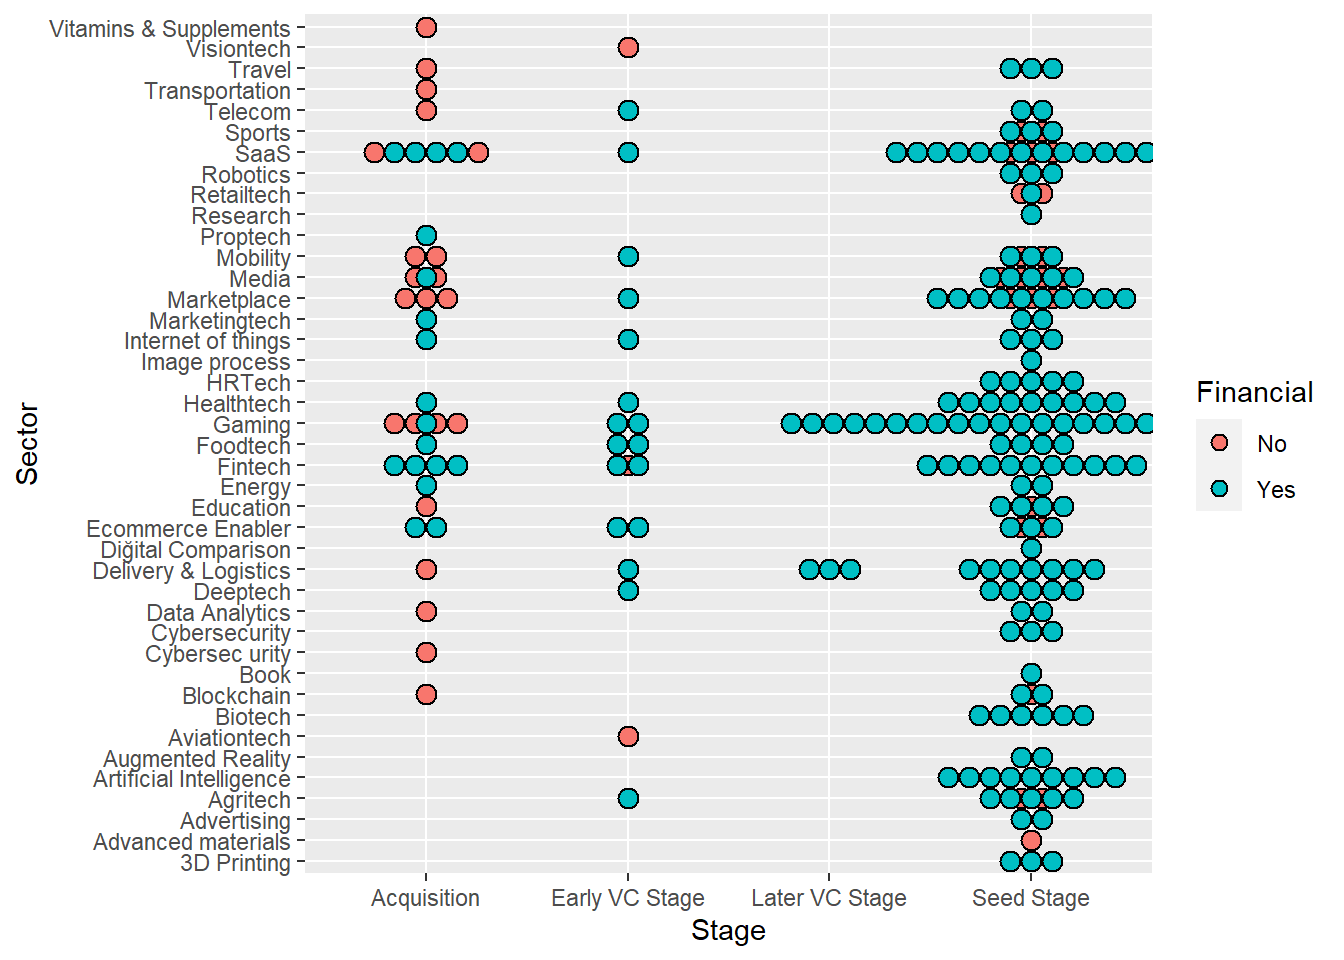
Which investor making the highest number of investment according to sector in every investment stage
Show the code
data_investor %>% separate_rows(Investor,sep = ",") %>% head()# A tibble: 6 × 10
Company Sector Inves…¹ Date Finan…² Origin Stake DealV…³ Stage inves…⁴
<chr> <chr> <chr> <date> <chr> <chr> <dbl> <dbl> <chr> <int>
1 Abonesep… SaaS "Keire… 2021-06-01 Yes Turkey 5 100000 Seed… 2
2 Abonesep… SaaS " Berk… 2021-06-01 Yes Turkey 5 100000 Seed… 2
3 Abrakada… Gaming "WePla… 2021-12-01 Yes Turkey 5 250000 Seed… 1
4 Ace Games Gaming "Acter… 2021-04-01 Yes Turke… NA NA Seed… 5
5 Ace Games Gaming " NFX" 2021-04-01 Yes Turke… NA NA Seed… 5
6 Ace Games Gaming " Kris… 2021-04-01 Yes Turke… NA NA Seed… 5
# … with abbreviated variable names ¹Investor, ²Financial, ³DealValue,
# ⁴investor_numberShow the code
df_investor<-data_investor %>% separate_rows(Investor,sep = ",")
df_investor <- df_investor %>% select(Investor,Stage,Sector)
df_investor %>% group_by(Stage,Sector,Investor) %>% summarise(Number_of_invesmment=n()) %>% arrange(desc(Number_of_invesmment))
# A tibble: 628 × 4
# Groups: Stage, Sector [73]
Stage Sector Investor Number_of_in…¹
<chr> <chr> <chr> <int>
1 Seed Stage Gaming "Games United" 8
2 Seed Stage Gaming "WePlay Ventures" 7
3 Acquisition Gaming "Rollic" 3
4 Acquisition SaaS "Verusaturk GSYO" 2
5 Early VC Stage Gaming " Balderton Capital" 2
6 Early VC Stage Gaming " Makers Fund" 2
7 Later VC Stage Delivery & Logistics " Goodwater Capital" 2
8 Later VC Stage Delivery & Logistics " Tiger Global Management" 2
9 Seed Stage Advertising " twozero Ventures" 2
10 Seed Stage Agritech "Startup Wise Guys" 2
# … with 618 more rows, and abbreviated variable name ¹Number_of_invesmment** So if we have a company in the seed stage and in the gaming sector, it is very meaningfull to aim ınvestors like “Games United” and “WePlay Ventures” in order to get investment **