Show the code
library(tidyverse)
library(dplyr)
library(readxl)
library(lubridate)
library(tidyr)
library(zoo)
library(janitor)
library(reactable)
library(data.table)
library(ggplot2)
library(stats)
library(DT)
library(scales)library(tidyverse)
library(dplyr)
library(readxl)
library(lubridate)
library(tidyr)
library(zoo)
library(janitor)
library(reactable)
library(data.table)
library(ggplot2)
library(stats)
library(DT)
library(scales)ConsIndex <- readRDS("Datards/ConsIndex.rds")
Turnover <- readRDS("Datards/Turnover.rds")
House_sales_to_foreigners_month <- readRDS("Datards/House_sales_to_foreigners_month.rds")
House_sales_to_foreigners_year <- readRDS("Datards/House_sales_to_foreigners_year.rds")
monthly_usd_to_try <- read_excel("data/monthly_usd_to_try.xls")
PATH <- "data/House Sales by Provinces.xls"
house_sales_by_provinces <- read_excel(PATH, range = cell_rows(14:129), col_names = names(read_excel(PATH, skip = 2)))
total_sales_by_year <- aggregate(house_sales_by_provinces[3], house_sales_by_provinces[1], FUN=sum)
House_sales_to_foreigners_month <- read_excel("data/House sales to foreigners.xls",
sheet = "Month")
monthly_usd_to_try <- read_excel("data/monthly_usd_to_try.xls")
cost_exchange <- readRDS("cost_exchange.rds")
HSTFBN <- read_excel("data/HSTFBN.xls", sheet = "FOREIGNERS BY NATIONALITIES")
House_sales_to_foreigners_by_province <- read_excel("data/House sales to foreigners by province.xls",
sheet = "HouseSalesByProvince")
house_sales_by_districts_preprocessed <- readRDS("Datards/house_sales_by_districts_preprocessed.rds")We are importing construction cost index, Turnover rate, usd to tl exchange rate, House sales to foreigners, House Sales by Province data sets and more datasets.
Objectives of this project is as follows: - Clean and analyze data on foreign house sales in Turkey to extract insights and understand the current state of the housing market.
Foreign house sales in Turkey have increased sil in recent years, with the number of sales to foreign buyers reaching a record high in 2020. This trend has been driven by a number of factors, including Turkey’s growing economy, its attractive climate and natural beauty, and its status as a popular tourist destination.
To better understand the factors that impact foreign house sales in Turkey, we may need to change some data types in order to more effectively analyze the data. For example, we may need to convert certain variables such as construction costs and exchange rates from raw data into more meaningful metrics. By cleaning and transforming the data in this way, we can gain a deeper understanding of the trends and patterns in the housing market and make more informed predictions about its future growth.
monthly_usd_to_try$month <- as.Date(monthly_usd_to_try$month)
colnames(monthly_usd_to_try) <- c("date","value")

House_sales_to_foreigners_month$Month <- match(House_sales_to_foreigners_month$Month, month.name)

House_sales_to_foreigners_month$Date <- as.yearmon(paste(House_sales_to_foreigners_month$Year, House_sales_to_foreigners_month$Month), "%Y %m")Overall, total sales of houses in the country remained strong during the period. Sales to foreigners accounted for a small portion of total sales, at 3%. The sales to foreigners share was within the acceptable range of 3-5.5%, indicating that the level of foreign demand for houses in the country was not significantly impacting the domestic market.
It is important to monitor the level of foreign demand for houses in the country, as excessive foreign demand could potentially drive up prices and make housing less affordable for domestic buyers. Efforts should be made to maintain a balanced mix of domestic and foreign demand in order to ensure the long-term stability of the housing market.
ggplot(House_sales_to_foreigners_month, aes(Date)) +
  geom_line(aes(y = `Share (%)`, colour = "Share (%)"))+
   ggtitle("Sales To Foreigners Share") +
  xlab("Year") +
ylab("Share") 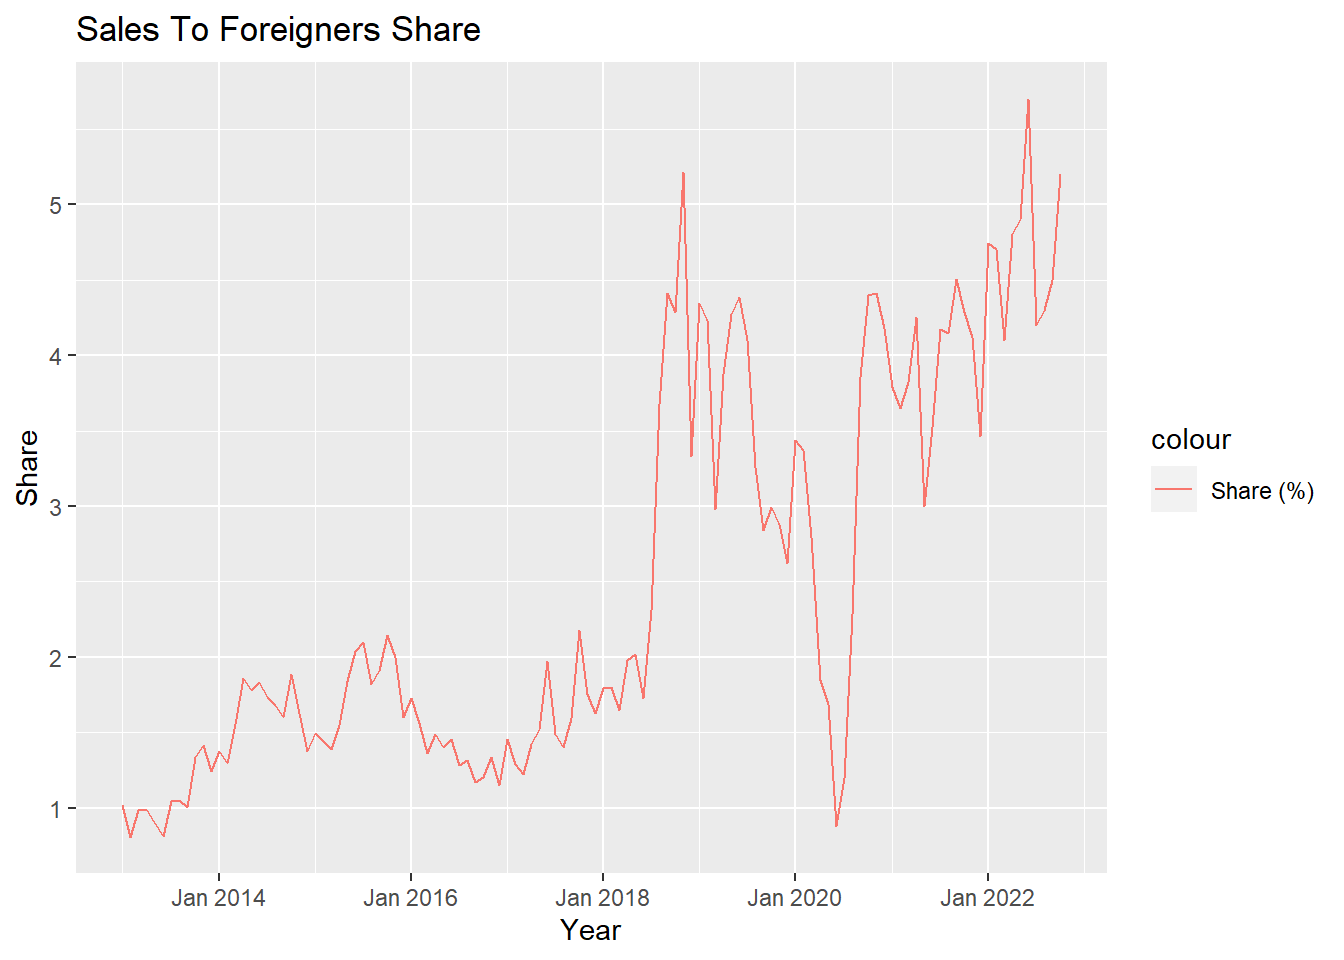
total_sale_by_country <- HSTFBN %>% group_by(year,country) %>% filter(country %in% c("Russia","Iran", "Iraq")) %>% summarise(sum=sum(total), .groups = 'drop')


ggplot(data=total_sale_by_country,aes(x=year,y=sum,fill=country)) +
  geom_bar(stat="identity",position = "dodge")+
  ggtitle("House Sales By Nationalities") +
  xlab("Country") +
ylab("House Sales") 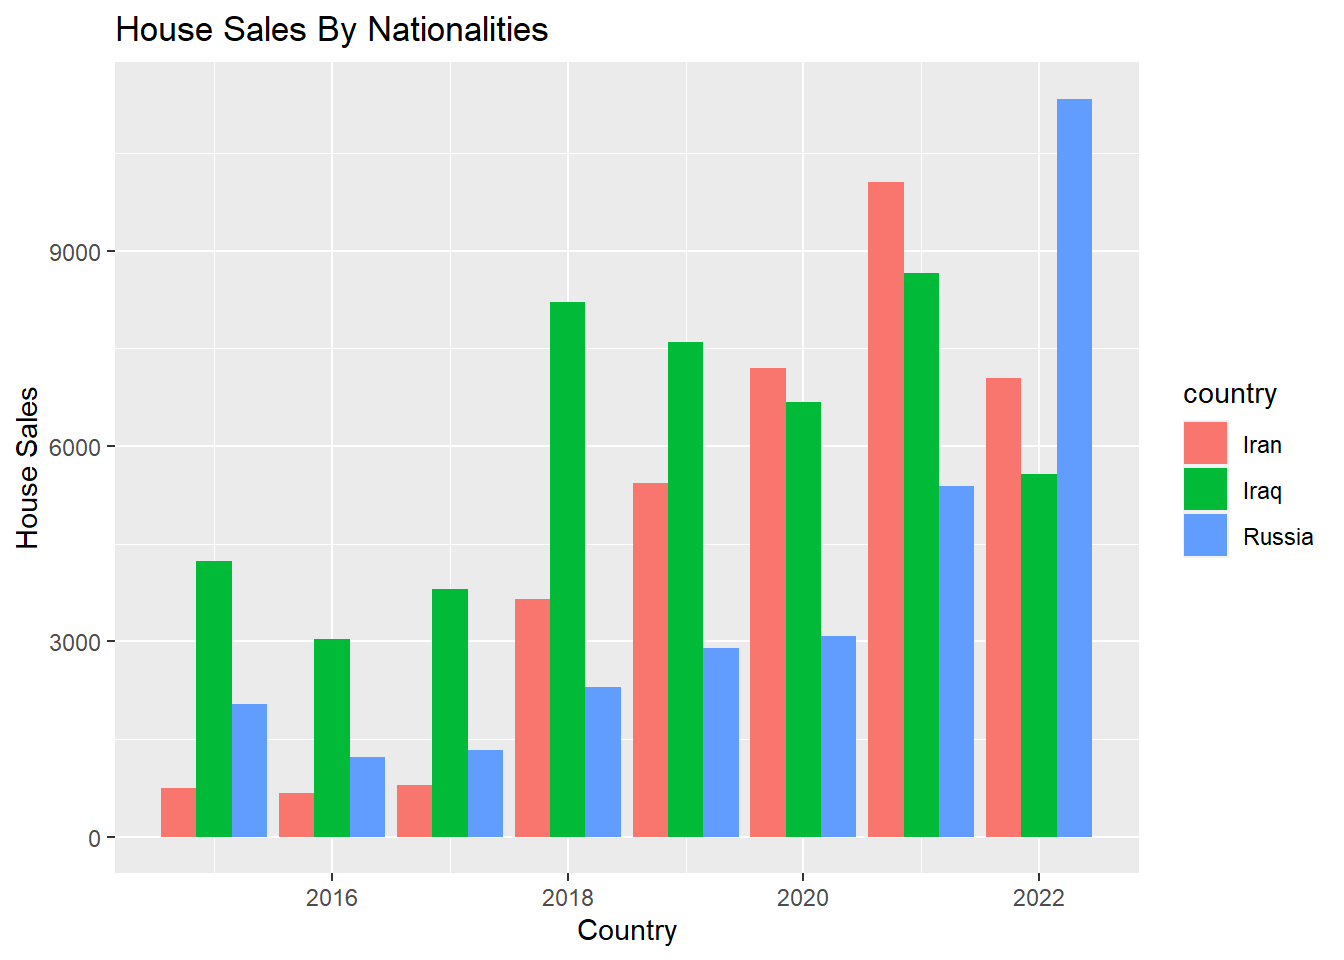
House_sales_to_foreigners_by_province <- pivot_longer(House_sales_to_foreigners_by_province,3:14,names_to = "Month", values_to = "sales")

datatable(House_sales_to_foreigners_by_province)
To provide a more detailed picture of the current state of foreign house sales in Turkey, here are some key statistics:
The construction cost index and turnover index were compared for the year 2015 and subsequent years. In 2019, the construction cost index exceeded the turnover index, indicating that the cost of construction was outpacing the revenue generated from construction projects. This trend continued in the following years, with the construction cost index consistently exceeding the turnover index.
This is a concerning trend, as it suggests that the construction industry is becoming less profitable over time. It may be necessary to reassess business strategies and cost-saving measures in order to address this issue and improve the financial viability of construction projects. It will also be important to monitor any changes in market conditions that may be contributing to the widening gap between the construction cost index and turnover index.
ConsIndexYear <- ConsIndex %>% group_by(Year) %>% summarise(Construction_cost_mean = mean(index, na.rm = TRUE))
TurnoverYear <- Turnover %>% group_by(Year) %>% summarise(Turnover_mean = mean(`seasonal and calendar adjusted
Index`))

ConsIndexYear %>% left_join(TurnoverYear, by = "Year") %>% ggplot(aes(Year)) +
  geom_line(aes(y = Construction_cost_mean, colour = "Construction cost mean")) +
  geom_line(aes(y = Turnover_mean, colour = "Turnover mean"))+
  labs(title="Construction cost and Turnover index yearly mean comparison")+
  xlab("Year") +
  ylab("Index")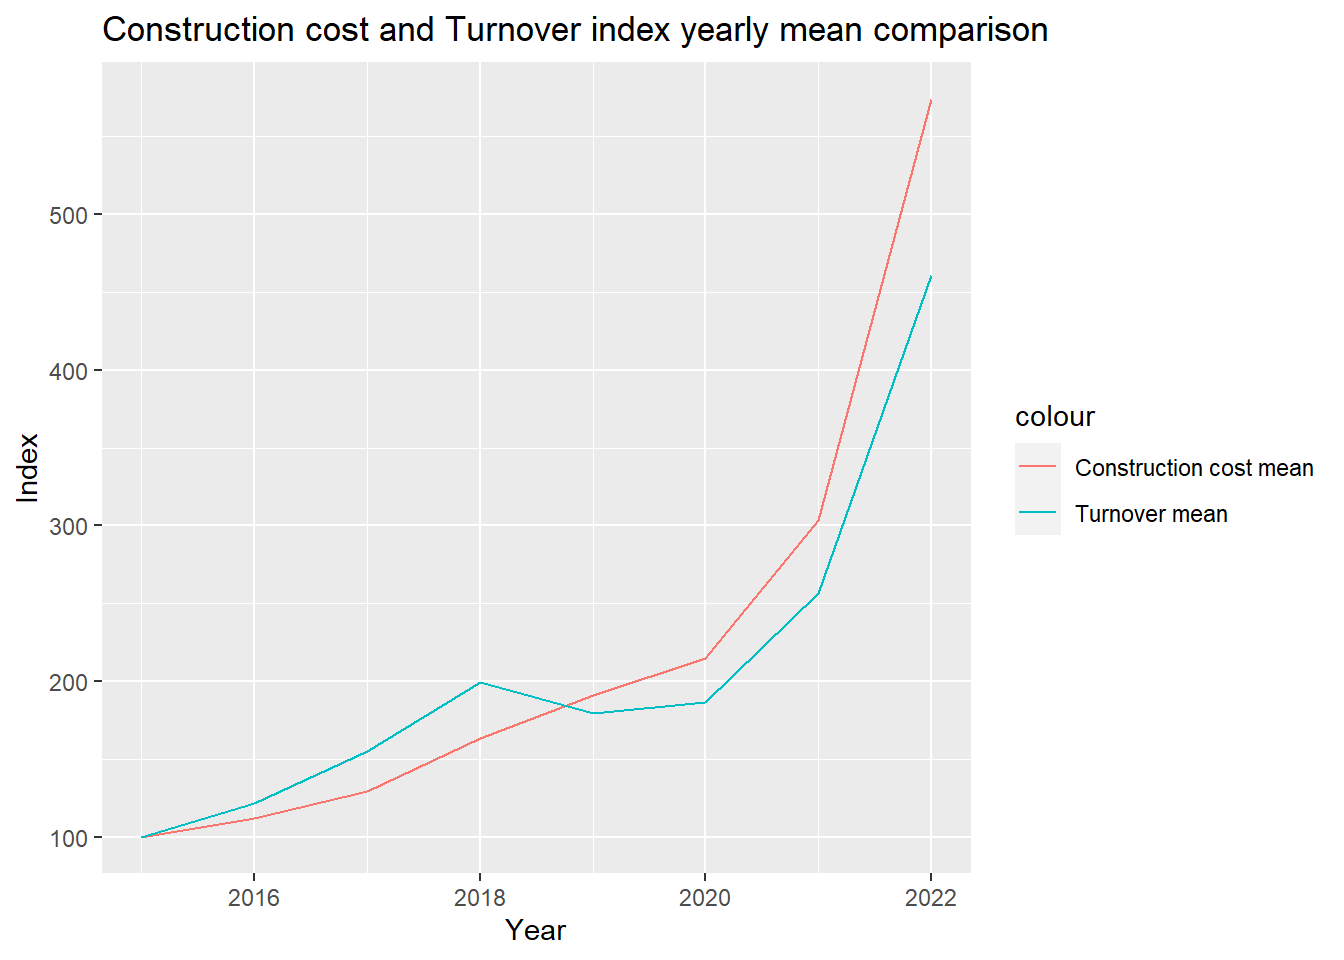
To provide a better understanding of how construction costs index increase in Turkey compare to European Cost index
.png)
The construction cost index in Turkey has been increasing at a faster rate compared to the construction cost index in Europe. Over the past year, the construction cost index in Turkey has increased at least six times more than the construction cost index in Europe. This trend suggests that the cost of construction in Turkey is rising more quickly than the cost of construction in Europe.
Understanding the reasons behind this trend is important in order to address the issue and improve the financial viability of construction projects in Turkey. It may be necessary to reassess business strategies and cost-saving measures in order to better manage construction costs in Turkey. It will also be important to monitor any changes in market conditions that may be contributing to the increasing construction cost index in Turkey.
ggplot(data=monthly_usd_to_try, aes(x=date, y=value, group=1)) +
  geom_line()+
  geom_point()+
  labs(title="Exchange rate - USD/TL")+
  xlab("Date") +
  ylab("Value")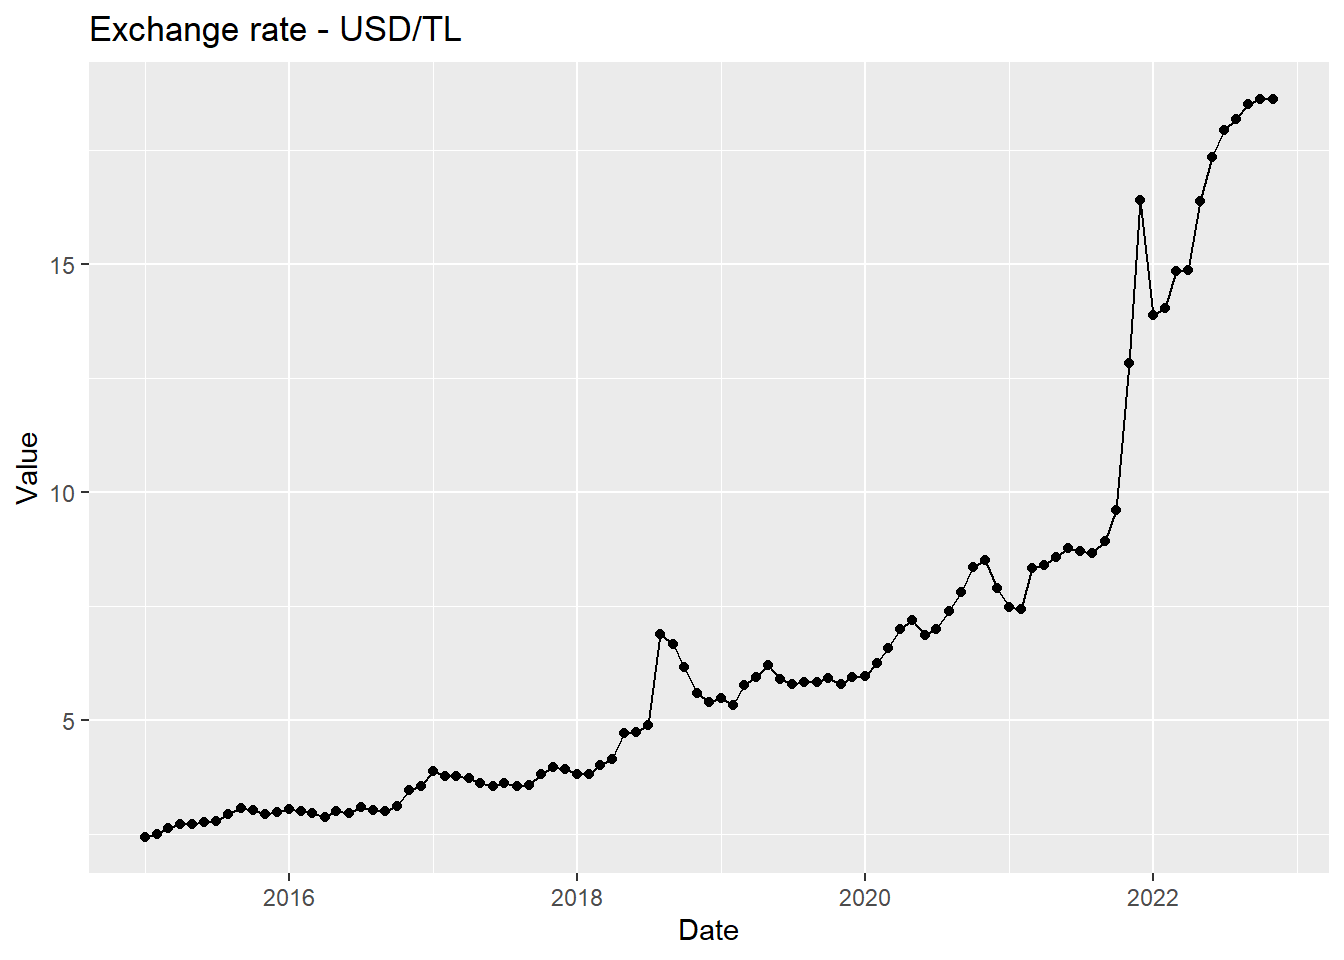
We asked our-self does the exchange rate of the Turkish lira affect the construction cost in Turkey? The analysis use statistical techniques such as regression analysis to investigate the relationship between the exchange rate of the Turkish lira and the construction cost index in Turkey.
model <- lm(value.x ~ value.y, data = cost_exchange)
summary(model)
Call:
lm(formula = value.x ~ value.y, data = cost_exchange)

Residuals:
     Min       1Q   Median       3Q      Max
-150.914   -5.314    2.424   11.791   69.973

Coefficients:
            Estimate Std. Error t value Pr(>|t|)
(Intercept)  -3.0956     5.3951  -0.574    0.568
value.y      33.9531     0.7154  47.460   <2e-16 ***
---
Signif. codes:  0 '***' 0.001 '**' 0.01 '*' 0.05 '.' 0.1 ' ' 1

Residual standard error: 27.82 on 91 degrees of freedom
Multiple R-squared:  0.9612,    Adjusted R-squared:  0.9607
F-statistic:  2252 on 1 and 91 DF,  p-value: < 2.2e-16
Based on these values, the strength of the relationship between the dependent and independent variables in the regression model can be assessed as follows:
Overall, based on these measures and statistics, the strength of the relationship between the dependent and independent variables in the regression model can be considered strong.
The exchange rate crisis in Turkey are contributing to an increase in construction costs. When the value of a Turkey’s currency decreases, it make imports more expensive, which can impact the cost of materials and other inputs that are used in the construction industry.
When construction costs increase, it can make it more expensive to build new houses, which could lead developers to build fewer homes or to pass on the higher costs to buyers in the form of higher prices.
The increase in construction costs were contributing to a decrease in the number of new houses being built, which in turn led to a decrease in first-hand house sales and an increase in second-hand sales since 2018.
When demand for housing is high and there is a limited supply of homes available, it can drive up prices as buyers compete for the available properties. This is the situtation happening in Turkey. In an effort to control rising house prices, the government implemented new policy measures which is limiting mortgage credit. As can be seen from the graphs, this effort did not significantly effect the total house sales while it decreases the morgaged house sales. There could be many reason behind this effect such as taking personal finance credit to buy house, changing savings such as gold and foreign currency to buy house.
house_sales <- house_sales_by_districts_preprocessed %>%
  group_by(year) %>%
  summarise(morgaged=sum(mortgaged), total=sum(total), first_hand=sum(first_hand), second_hand=sum(second_hand))

ggplot(data=house_sales,aes(x=year),group = 1 ) +
  geom_line(aes(y=first_hand,color='first_hand')) +
  geom_line(aes(y=second_hand,color='second_hand')) +
  labs(title="Total First Hand & Second Hand House Sales")+
  xlab("Year")+
  ylab("Total House Sales")+
  scale_y_continuous(labels = label_comma())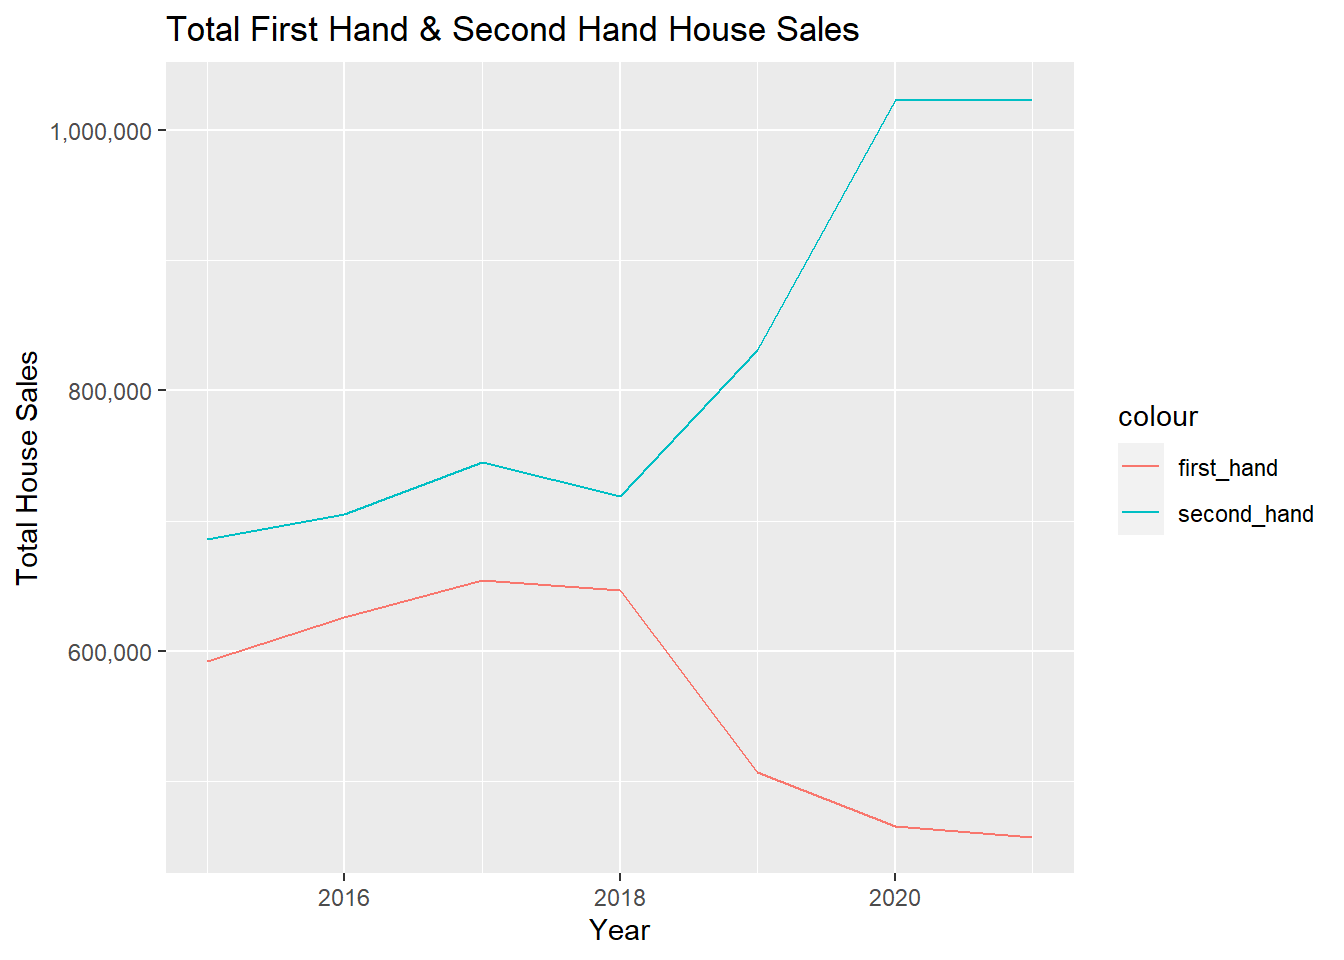
house_sales <- house_sales_by_districts_preprocessed %>%
  group_by(year) %>%
  summarise(morgaged=sum(mortgaged), total=sum(total), first_hand=sum(first_hand), second_hand=sum(second_hand))


ggplot(data=house_sales,aes(x=year),group = 1 ) +
  geom_line(aes(y=morgaged,color='morgaged')) +
  geom_line(aes(y=total,color='total'))+
  labs(title="Total House Sales & Morgaged House Sales")+
  xlab("Year")+
  ylab("Total Sales")+
  scale_y_continuous(labels = label_comma())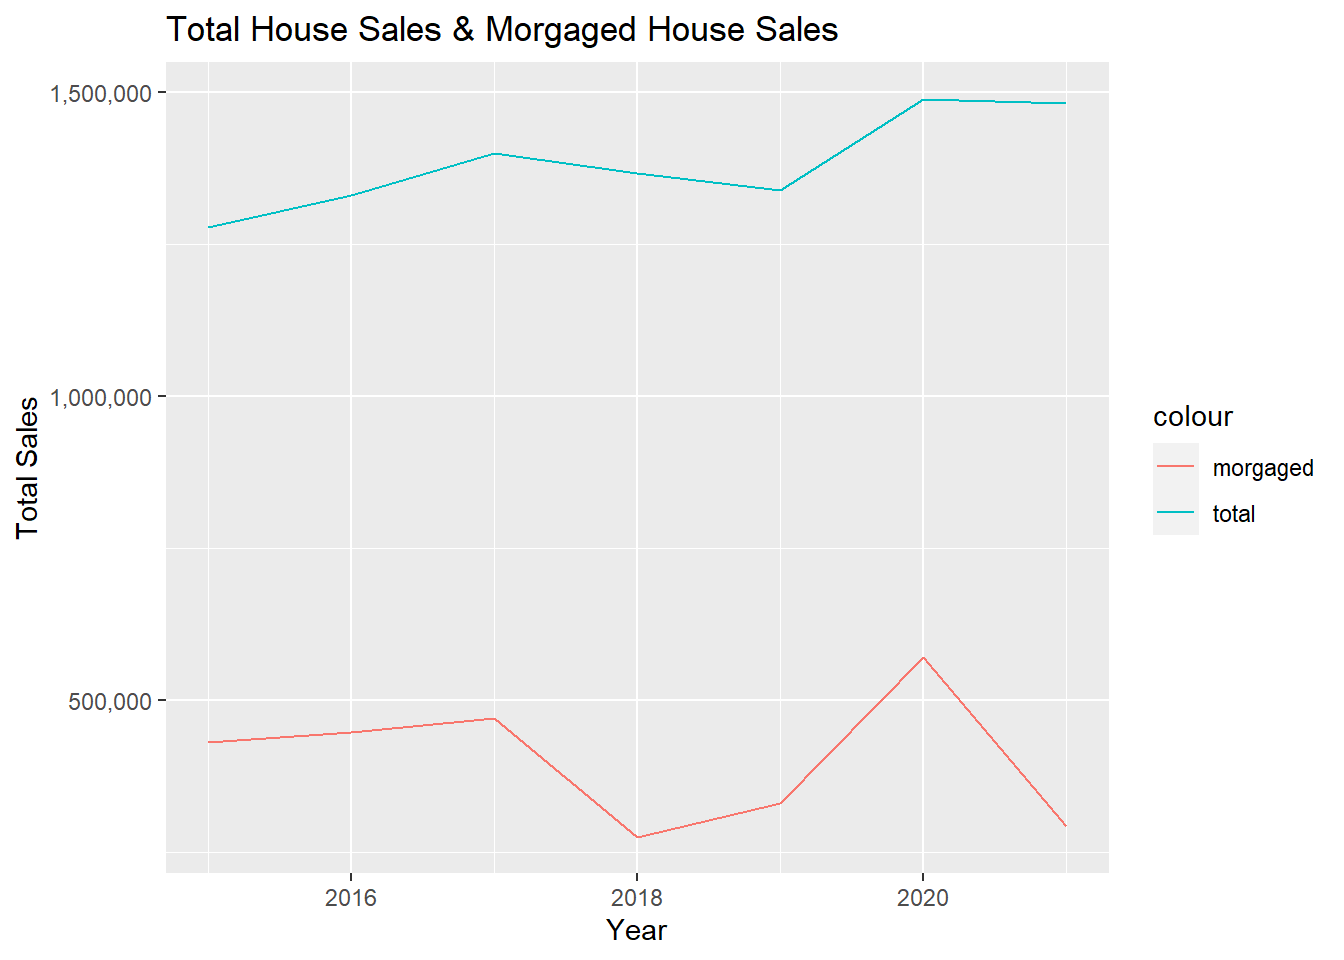
In conclusion, the housing market in Turkey has been facing some challenges in recent years, including rising construction costs and the impact of exchange rates. Foreign house sales in Turkey have increased slightly, but still only account for a small portion (around 5%) of total sales. The construction cost index in Turkey has been increasing at a faster rate compared to the construction cost index in Europe, making construction in Turkey less profitable. The results of the analysis could show that there is a negative relationship between the exchange rate of the Turkish lira and the construction cost index in Turkey. This means that when the value of the Turkish lira declines, the construction cost in Turkey tends to go higher.The conclusion of the Regression analysis could be that the exchange rate of the Turkish lira has a significant impact on the construction cost in Turkey. This finding could be useful for policymakers and construction industry stakeholders to understand the economic factors that affect the construction industry in Turkey and to develop strategies to mitigate the impact of exchange rate fluctuations on construction costs.
It is important to continue monitoring these and other factors in order to better understand the current state of the housing market in Turkey and make more informed predictions about its future growth. The level of foreign demand for houses in Turkey should also be monitored in order to ensure a balanced mix of domestic and foreign demand and maintain the long-term stability of the market. The government’s limit on mortgages in 2021 has decreased sales of housing with credit, but total sales have not decreased as people are buying houses with cash from other sources. The most popular cities for foreign house buyers in Turkey are Istanbul, Antalya, and Bursa.
Overall, it will be important to carefully analyze the trends and patterns in the market and the factors that can affect them in order to identify potential challenges and opportunities. By doing so, it will be possible to make informed decisions and plan for the future growth of the housing market in Turkey.