Hello, I am Muhammed Ali Gökmen and 24 yo. I finished my Bachelor of City and Regional Planning in 2020 from Mimar Sinan Fine Arts University with the thesis of “The Relationship Between Smart Cities and Smart Energy Systems: The sample of Urban Planning”. I examined in one part of my thesis that how smart energy systems can effectively manage by technology of big data and IoT. Also in my university years, I always curious about data and how to process it effectively. I have got Python class in university, some data analytics and statistics courses on Udemy and other educational places to get some insights and see what I can do in this area on the basis of personal curiosity. Besides, in my part time job I had the chance to practice the theoretical knowledge I learned from this course. While last year of my university I worked for Turkish Airlines as a part time clerk. I enhanced my data analytics skills in this meantime to have a oppurtunity to get hired there and keep pushing developing myself. After graduation I got hired as a specialist in the Management of Strategic Planning and Data Analysis Turkish Airlines and still working there now. In general, we are responsible for the analysis of reports flowing into our database. Basically, we clean the data by doing the relevant filters, then analyze it and focus on making meaningful inferences. We report the results to our executives in order to contribute to their decision-making processes.I want to use data analytics skills in our monthly sales forecasting process to shape it more understandable and realistic.
1.2Dashboard-Builder: Building Shiny Apps without writing any code
I have preferred to watch the conference named “Dashboard-Builder: Building Shiny Apps” presenting by Peter Gandenberger.
In this conference, Mr. Ganderberger appealed to people who want to make dashboard but don’t know how to code in R and consider that R complex. So, last project of Peter’s team allows people to make interactive dashboards.
This drag&drop dashboard builder lowering the barrier for entry new users starting their data-science journey.
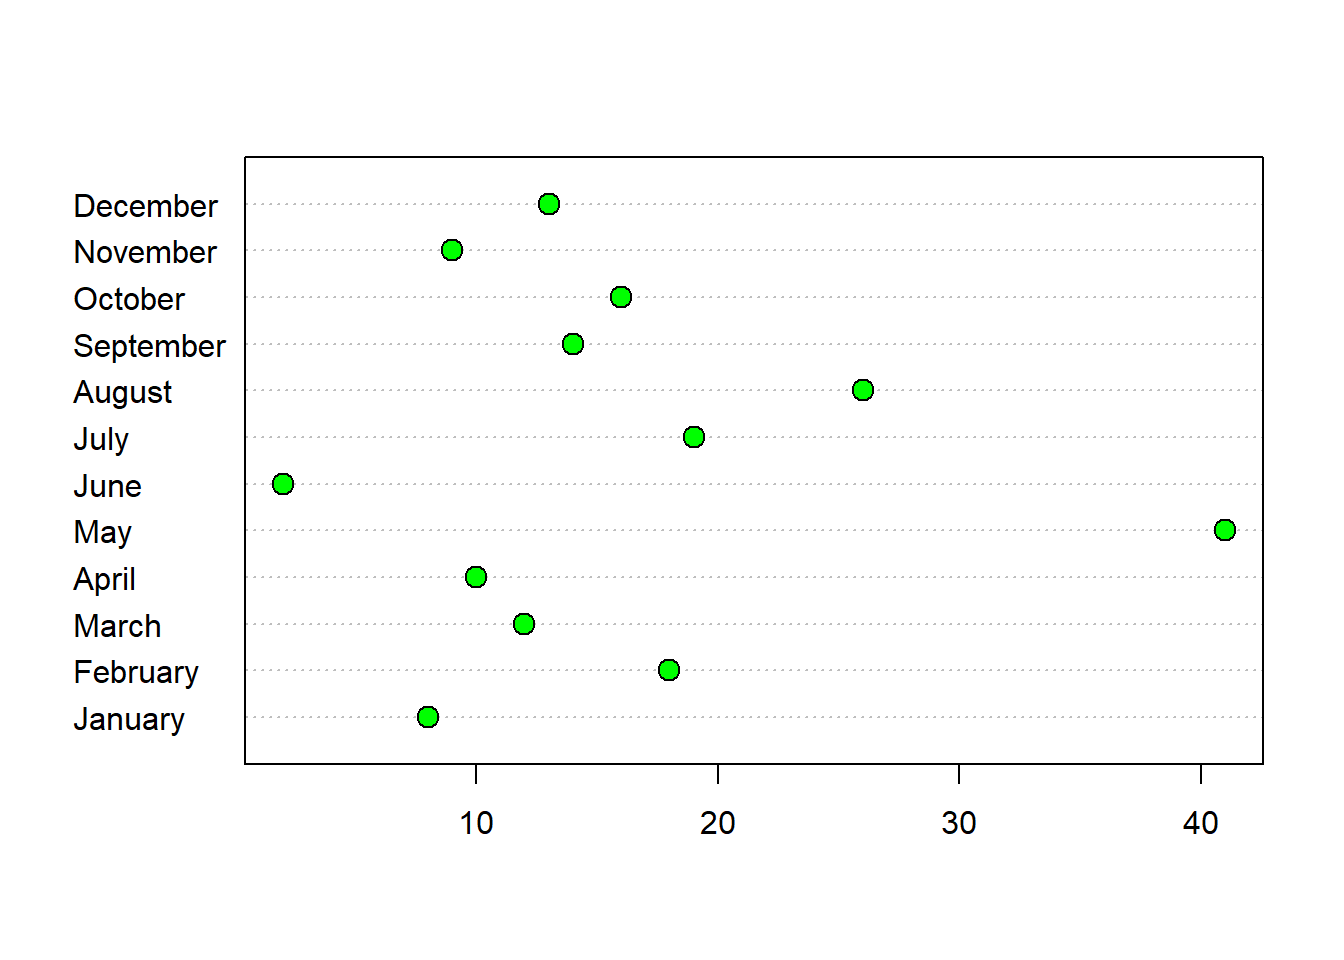
       month expected sold quarter
1    January       15    8       1
2   February       16   18       1
3      March       20   12       1
4      April       31   10       2
5        May       11   41       2
6       June        6    2       2
7       July       17   19       3
8     August       22   26       3
9  September       32   14       3
10   October       12   16       4
11  November       19    9       4
12  December       20   13       4