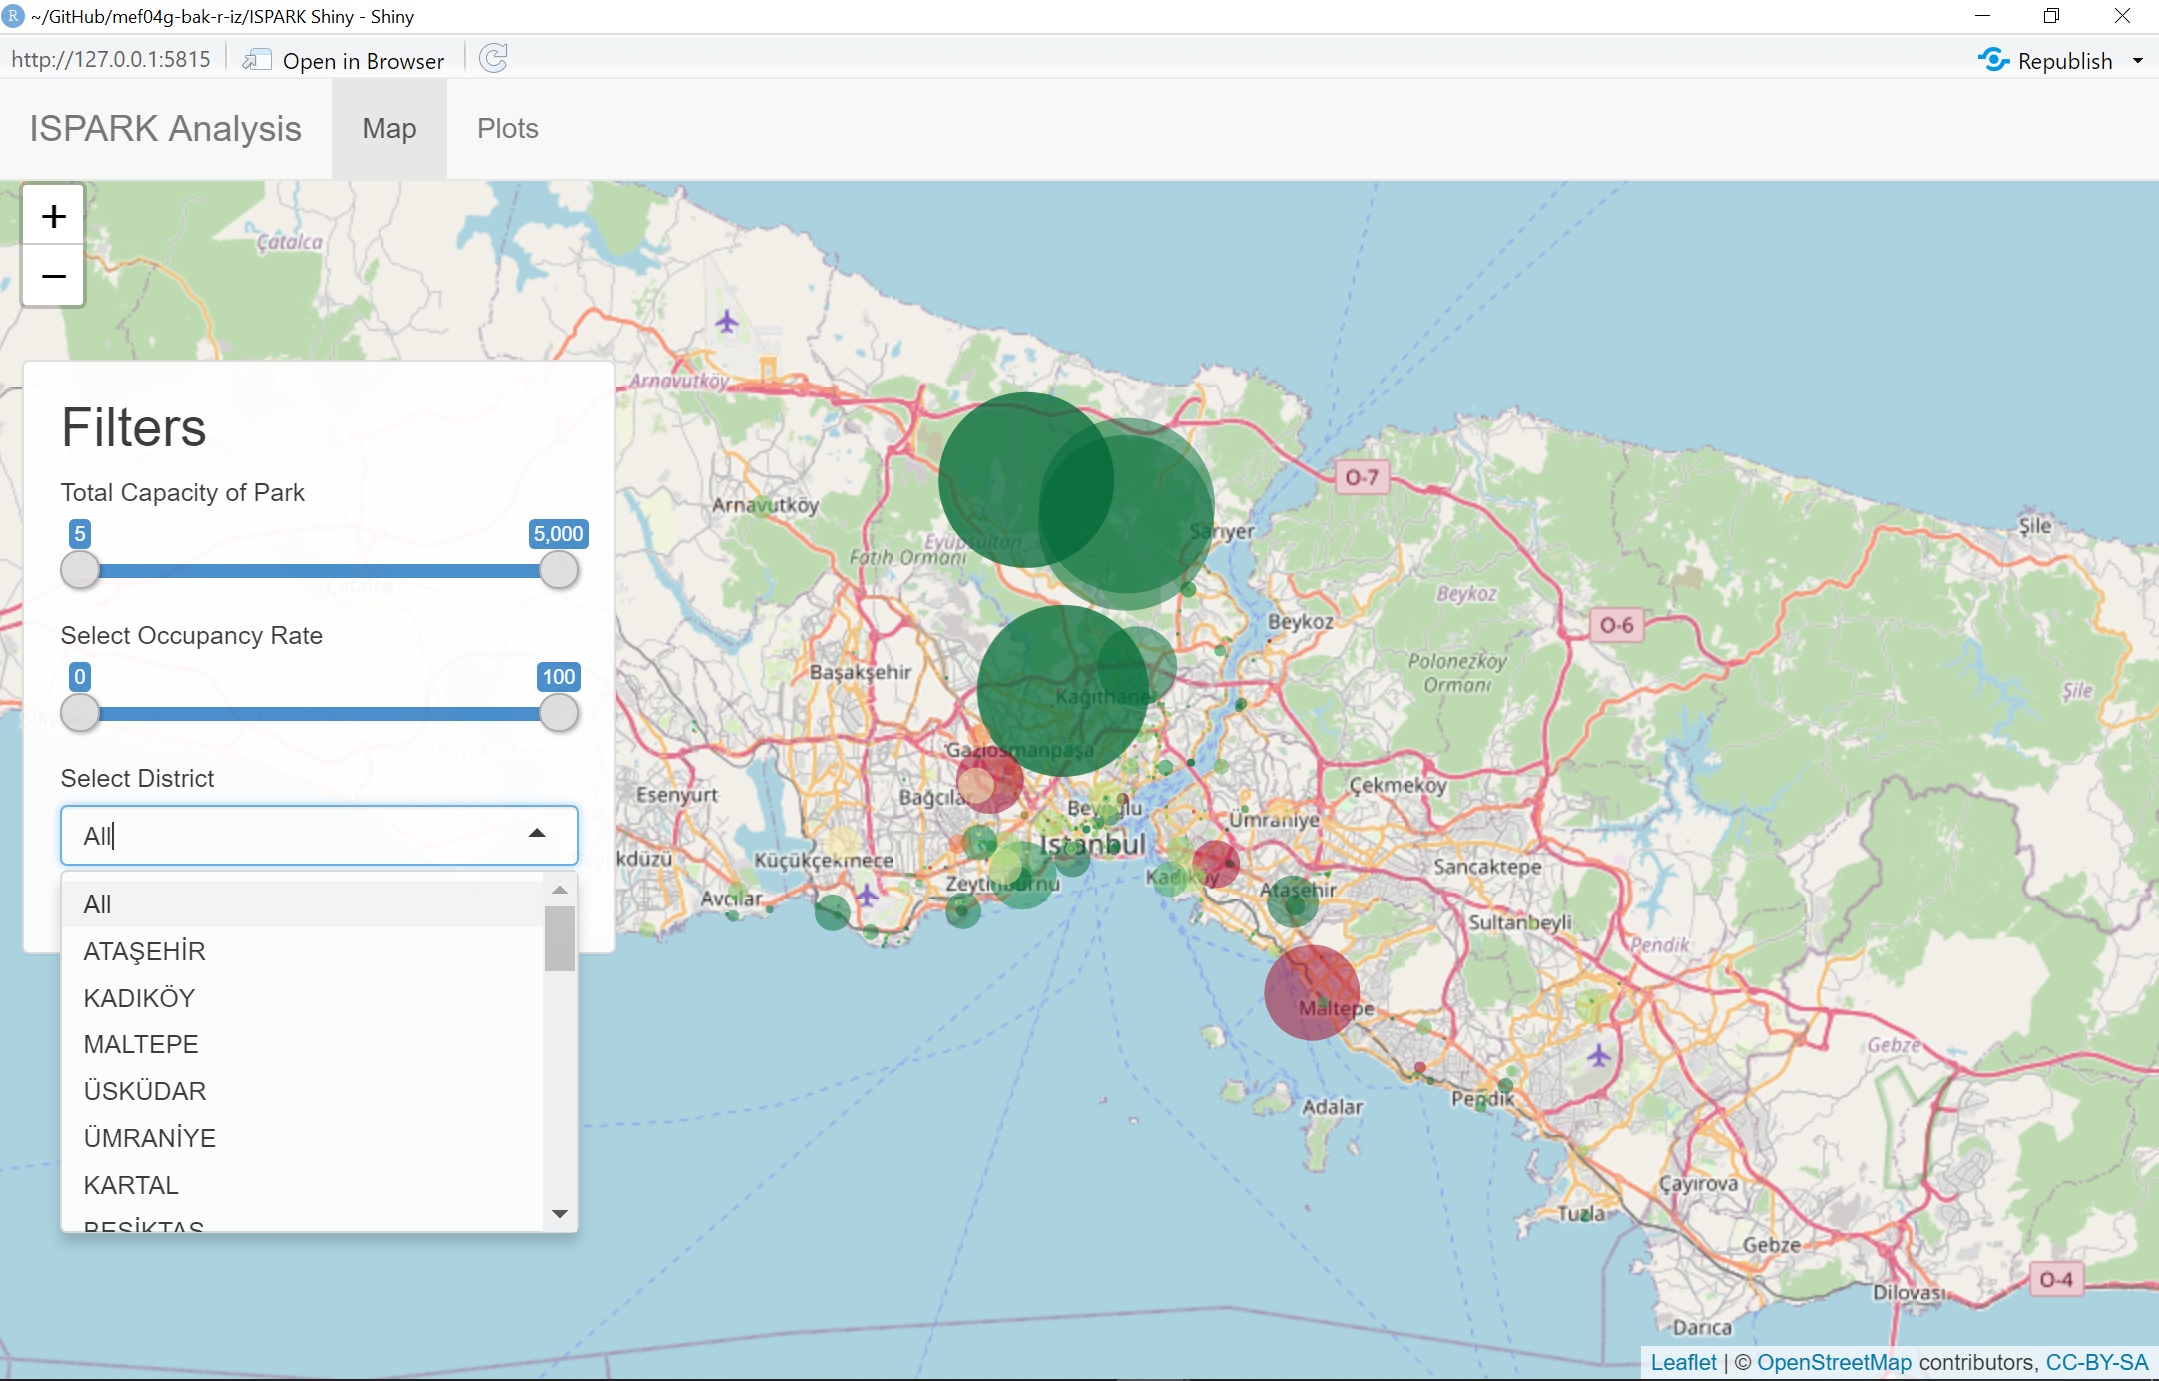
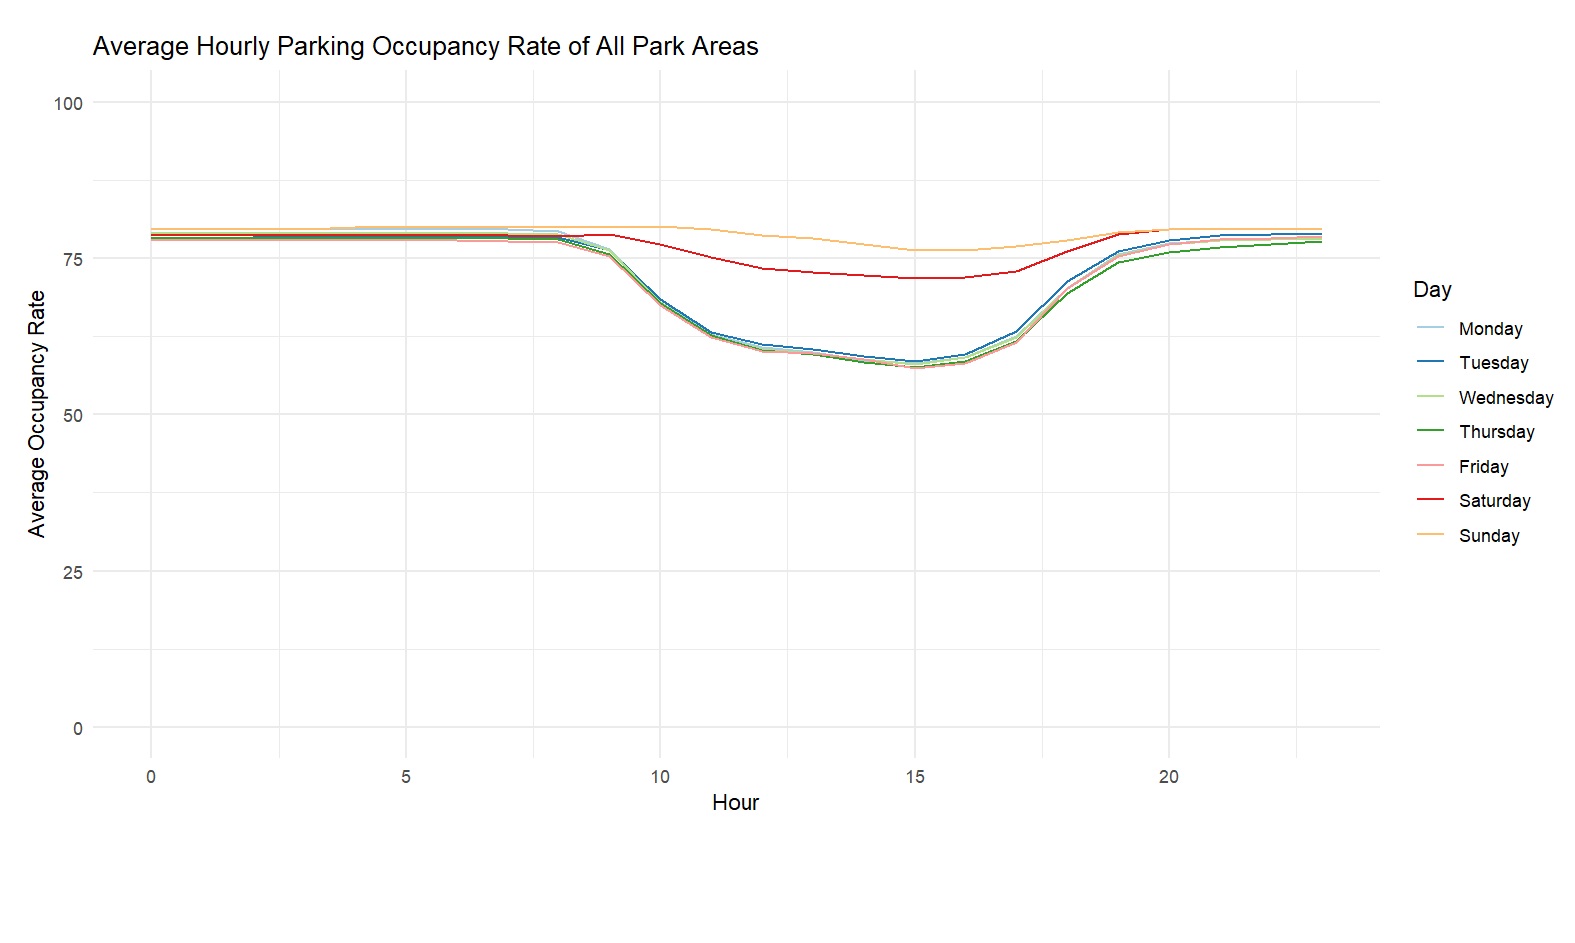
class: inverse, center, middle # ISPARK PROJECT # B - a - k - R - ı - z ## Group Members Alihan BÜYÜKEKEN Bilgen YILMAZ Buğra BALANTEKİN Hüseyin EROĞLU İdil KAZEZYILMAZ --- class: inverse, center, middle  --- class: inverse, center, middle # Table of Contents Brief Information About Dataset Our Mission Tables & Plots Shiny App --- class: inverse, center, middle # Brief Information About Dataset We have two tables in our dataset. First table contains informations about ISPARK park areas. Second table contains hourly percentage of occupancies of these park areas between 19 November 2020 and 2 December 2020. We have collected this data by using IBB OpenData API. You can also access this API from [here.](https://api.ibb.gov.tr/ispark/Park) --- class: inverse, center, middle # Our Mission Understanding the relation between the park capacity and the other metric. Creating shiny app that recommends best suitable parking spots with given limits. You can check our app from [here.](https://alihan.shinyapps.io/ISPARK-Shiny/) --- class: inverse, left, middle # Park Type Summary Table We can see the count, total capacity and avg. monthly price in below table. We have 5 different park types. "ON ROAD" type park is the highest with number of the parks also with pricing. "OPEN OTOPARK" type is the highest with the total capacity. ``` ## # A tibble: 5 x 6 ## # Groups: ParkTipi [5] ## ParkTipi `Park Adeti` `Toplam Kapasit~ `Ortalama Kapat~ `Ortalama Ücret~ ## <chr> <int> <int> <dbl> <dbl> ## 1 YOL ÜSTÜ 349 14128 40.5 12.5 ## 2 AÇIK OT~ 163 71394 438 8.99 ## 3 KAPALI ~ 53 23608 445. 11.8 ## 4 TAKSİ P~ 11 272 24.7 0 ## 5 MİNİBÜS~ 1 100 100 0 ## # ... with 1 more variable: `Ortalama Aylik Ucret` <dbl> ``` --- class: inverse, left, middle # Boxplot of Avg. Monthly Price Open Park has a lower mean of monthly price than 'Parking Garages' and 'Near-Road Parks'. Parking garage's monthly price has outliers. But despite those outliers, its monthly prices varies the least. <img src="Group-Project-Final-Presentation_files/figure-html/unnamed-chunk-2-1.png" width="50%" /> --- class: inverse, left, middle # Free/ Paid Parking Areas We have 196 free, 381 paid parks in Ispark. %52 of the free parks are On Near-Road Type of park. %40.8 of the free parks are Open Parks. <img src="Group-Project-Final-Presentation_files/figure-html/ucretdurumu, figures-side-1.png" width="50%" /><img src="Group-Project-Final-Presentation_files/figure-html/ucretdurumu, figures-side-2.png" width="50%" /> --- class: inverse, left, middle # Occupancy Rates In all park types, average parking occupancy rate during daytime (around 15:00) is less than nights. We can say on week days occupancy is lower than weekend days. <img src="Group-Project-Final-Presentation_files/figure-html/hourday, figures-side-1.png" width="50%" /><img src="Group-Project-Final-Presentation_files/figure-html/hourday, figures-side-2.png" width="50%" /> --- class: inverse, left, middle # Frequency of the Parks by District If we look at the frequencies of the parks Fatih district has the highest park number After Fatih, Besiktas and Sisli districts are amongst highest. Arnavutkoy and Sultangazi are almost equal and has the lowest frequency. <img src="Group-Project-Final-Presentation_files/figure-html/figures-side-1.png" width="50%" /> --- class: inverse, left, middle # Shiny App: Park Finder We wanted to create an app to find best park location suits user's selection, while giving information about that park. **For map, inputs are: ** `Total Capacity` : Total capacity of the park `Occupancy Rate` : Occupancy rate of the park `District` : Park's location as district **For plots, inputs are:** `District` : Park's location as district `Park Area Name` : Park's name --- class: inverse, center, middle #SHINY APP MAP The shiny app built can filter Districts, Total Capacity of Parks and Occupancy Rate .center[] --- class: inverse, center, middle #SHINY APP PLOT The Plot shows us that hourly average occupancy of all parks outside the working hours is around 75 pct. During the working hours occupancy rate falls below 60 pct. Saturday and Sunday have a different tendency. Sunday follows a linear trend almost in which occupancy level swings between 75-78 pct. .center[] --- class: inverse, center, middle #PURPOSE OF SHINY APP * Main purpose of our App is to show parks in Istanbul map according to their occupancy rate, Total Capacity and District. * Map part of our App also has a pop-up feature when clicked on to the green/red spot gives basic information about the mentioned park. The map can also zoom in/out when filters change accordingly * Plot part of the app has two main filter; District and Parks of the selected District. When filtered the plot visualizes the average occupancy of given park for every weekday hourly. If none of the filters are selected the plot shows the total average occupancy levels of all parks. --- class: inverse, center, middle # Key Findings * Total number of minibus and Taxi type of parks in Istanbul make the %2 of the total parks. * Fatih (%17) - Besiktas (%11) - Sisli (%11) - Bakirköy (%6.58) - Kadiköy (%6.58) are the top 5 districts that have the most park number %52 of the total number. But on the other hand capacity-wise Eyup has the biggest park capacity. We can say touristic areas has an advantage in terms of parking. * %33.96 of the parks are free. And On-Road or open parks are more likely to be free. * At 15:00 occupancy rate is the lowest for all park types expect Taxi parks. And closed parks are most likely to have empty space than others. * Open parking lots and parking garages are common in touristic and crowded places. * Roadside parking lots are common in less crowded areas. --- class: inverse, center, middle # Thank You! [Our Group Page](https://pjournal.github.io/mef04g-bak-r-iz/)