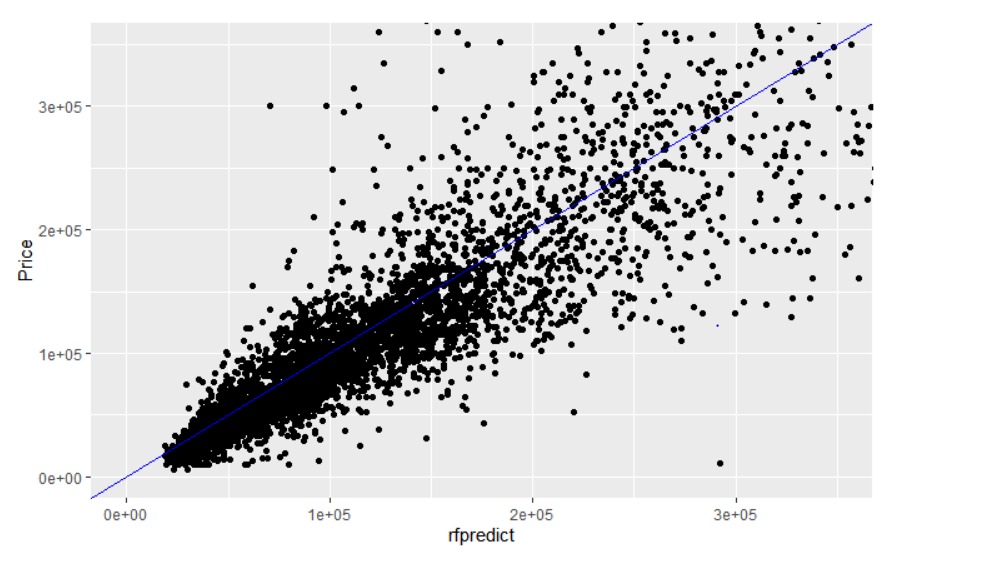
class: center, middle, inverse, title-slide # 2020 Online Car Market ## Exploratory Data Analysis and Price Forecast ### Data Mine’R’s ### Boğaziçi University ### 2020/09/07 --- class:left, bottom background-image: url(https://lh3.googleusercontent.com/proxy/aL3mmQIusLaBjxnrI_ol37ITt5M4hRW5S9oSCTV89zC-tfU0mcj2cVLca9dqGS9Wus_qArdfghUTFMv1fHknsTH43iwEny-s8_LSsPjVT8PxQaT2ZBPf--cPbQo6izkmzkeK) background-size: cover .pull-left[ ### GROUP MEMBERS **Can AYTÖRE**<br> **Ebru GEÇİCİ**<br> **Nazlı GÜL**<br> **Taha BAYAZ**<br> **Talha ÜNLÜ**<br> **Mustafa KESER**<br> ] .pull-right[ ### AGENDA **1. Data Information**<br> **2. Exploratory Data Analysis**<br> **3. Shiny App**<br> **4. Prediction Model**<br> **5. Conclusion**<br> ] --- ## 1. Data Information - [Kaggle dataset(Online Car Market 2020)](https://www.kaggle.com/alpertemel/turkey-car-market-2020) - 8834 row and 17 feature - Data check - NA and Duplicated Values - "Don't Know" Values - Variable Translation ``` ## [1] "Date" "Year" "Month" ## [4] "Brand" "Vehicle_Type_Group" "Vehicle_Type" ## [7] "Model_Year" "Fuel_Type" "Gear" ## [10] "CCM" "Horse_Power" "Color" ## [13] "Body_Type" "Seller" "Seller_Status" ## [16] "Kilometers" "Price" ``` - Accuracy of variables (Nonnegativity etc.) - Outliers - CSV to RDS - Packages: tidyverse, lubridate, data.table, scale, shiny, etc. --- ## 2. Exploratory Data Analysis-EDA **Objective:** To identify which variables affect the price mostly and come up with a conclusion for the relationship between variables. .pull-left[ - Time series analysis - The most and least popular car brands - Price vs Car brands - Price vs Body type - Price vs Fuel type - Price vs Gear - Price vs Gear grouped by fuel type - Price vs CCM - Price vs HP grouped by Seller status - Seller status vs Seller - Gear vs Car brands - The most popular car colors ] .pull-right[ <img src="Presentation_files/figure-html/unnamed-chunk-1-1.png" width="90%" style="display: block; margin: auto;" /> ] --- ## 2. Exploratory Data Analysis-EDA .pull-left[ <img src="Presentation_files/figure-html/unnamed-chunk-2-1.png" width="90%" style="display: block; margin: auto;" /> ] .pull-right[ <img src="Presentation_files/figure-html/unnamed-chunk-3-1.png" width="90%" style="display: block; margin: auto;" /> ] <font size="2"> .pull-left[ - There are many outliers in **Diesel** and **Electricity** Fuel Type.<br> - **Gasoline** is the least expensive fuel type, **Hybrid** is the most expensive one.<br> - The median **Hybrid** is very close to the first quantile.<br> - Since the price interval of the **Hybrid** is wider, there is no outlier data.<br> ] .pull-right[ - Price distribution in **Manual** gear type concentrates in a narrow area. <br> - **Semi automatic** and **Automatic** have a wider area with outliers.<br> ] </font> --- ## 2. Exploratory Data Analysis-EDA <img src="Presentation_files/figure-html/unnamed-chunk-4-1.png" width="90%" style="display: block; margin: auto;" /> - The most expensive cars are located in **Semi-Automatic** and **Automatic** Gear Type with **Hybrid** Fuel Type.<br> - While the **Hybrid** Fuel Type is more recent technology, there are no cars in **Manual** Gear Type.<br> - The least expensive cars are located in **Gasoline** Fuel Type in all Gear Types.<br> --- ## 2. Exploratory Data Analysis-EDA <img src="Presentation_files/figure-html/Seller vs Seller Status-1.png" width="90%" style="display: block; margin: auto;" /> <table class="table" style="font-size: 15px; margin-left: auto; margin-right: auto;"> <thead> <tr> <th style="text-align:left;"> Seller </th> <th style="text-align:right;"> 0 km </th> <th style="text-align:right;"> 2nd Hand </th> <th style="text-align:right;"> Classic </th> <th style="text-align:right;"> Damaged </th> </tr> </thead> <tbody> <tr> <td style="text-align:left;"> Authority </td> <td style="text-align:right;"> 94.0 </td> <td style="text-align:right;"> 6.0 </td> <td style="text-align:right;"> 0.0 </td> <td style="text-align:right;"> 0.0 </td> </tr> <tr> <td style="text-align:left;"> Galery </td> <td style="text-align:right;"> 2.2 </td> <td style="text-align:right;"> 97.3 </td> <td style="text-align:right;"> 0.0 </td> <td style="text-align:right;"> 0.5 </td> </tr> <tr> <td style="text-align:left;"> Owner </td> <td style="text-align:right;"> 0.7 </td> <td style="text-align:right;"> 98.5 </td> <td style="text-align:right;"> 0.4 </td> <td style="text-align:right;"> 0.4 </td> </tr> </tbody> </table> <center> <font size="2"> .pull-bottom[ **Gallery** and **Owner** mostly sell **2nd Hand** cars, whereas **Authority** sell **0 km** cars.<br> There are no seller status, which are **Classic** and **Damaged** in the **Authority** Seller.<br> ] </font> </center> --- ## 2. Exploratory Data Analysis-EDA <img src="Presentation_files/figure-html/Gear vs Brand-1.png" width="90%" style="display: block; margin: auto;" /> <font size="2"> .pull-bottom[ - The all cars of the **Chyrsler** and **Volkswagen** have only automatic gear type, in the 2020 online car market.<br> - **Geely**, **Lada**, and **Tofas** have only manual gear type.<br> - The other car brands have various gear type in their cars.<br> ] </font> --- ## 2. Exploratory Data Analysis-EDA .pull-left[ <img src="Presentation_files/figure-html/unnamed-chunk-5-1.png" width="90%" style="display: block; margin: auto;" /> ] .pull-right[ <img src="Presentation_files/figure-html/unnamed-chunk-6-1.png" width="90%" style="display: block; margin: auto;" /> ] --- ## 2. Exploratory Data Analysis-EDA <img src="Presentation_files/figure-html/unnamed-chunk-7-1.png" width="65%" style="display: block; margin: auto;" /> --- ## 3. Shiny App  --- ## 4. Prediction Model .pull-left[ - Models - Linear Regression - CART - Random Forest (Best Model) - Best Model Features: Gear, Horse_Power, Color, Kilometers, Model_Year, Fuel_Type, Body_Type - Best MSE: 1581517991 - Best R-Squared: 0.831 ] .pull-right[  ] --- ## Conclusion 1. In 2020, April has the highest online advertisement number. 2. Renault is the Turkey online market leader in 2020. 3. The most online advertisements are secondhand cars from the gallery. 4. Hybrid fuel type is the most expensive cars in online advertisement number. 5. Manual gear type has the highest online advertisement number. 6. Diesel fuel type has the 66% of online advertisements. 7. The higher price of a car, the lower number of advertisements they have. 8. Basic colors are more preferable in online advertisements. --- class: center, middle <font size="10"> .pull-bottom[ **THANK YOU!!** ] </font>